Samples
Generate academic figures without breaking your writing flow
This page is built for actual figure work, not generic image prompting. Paste method text, structured experiment data, or a rough draft figure, then iterate toward a version that is readable enough to drop into the paper.
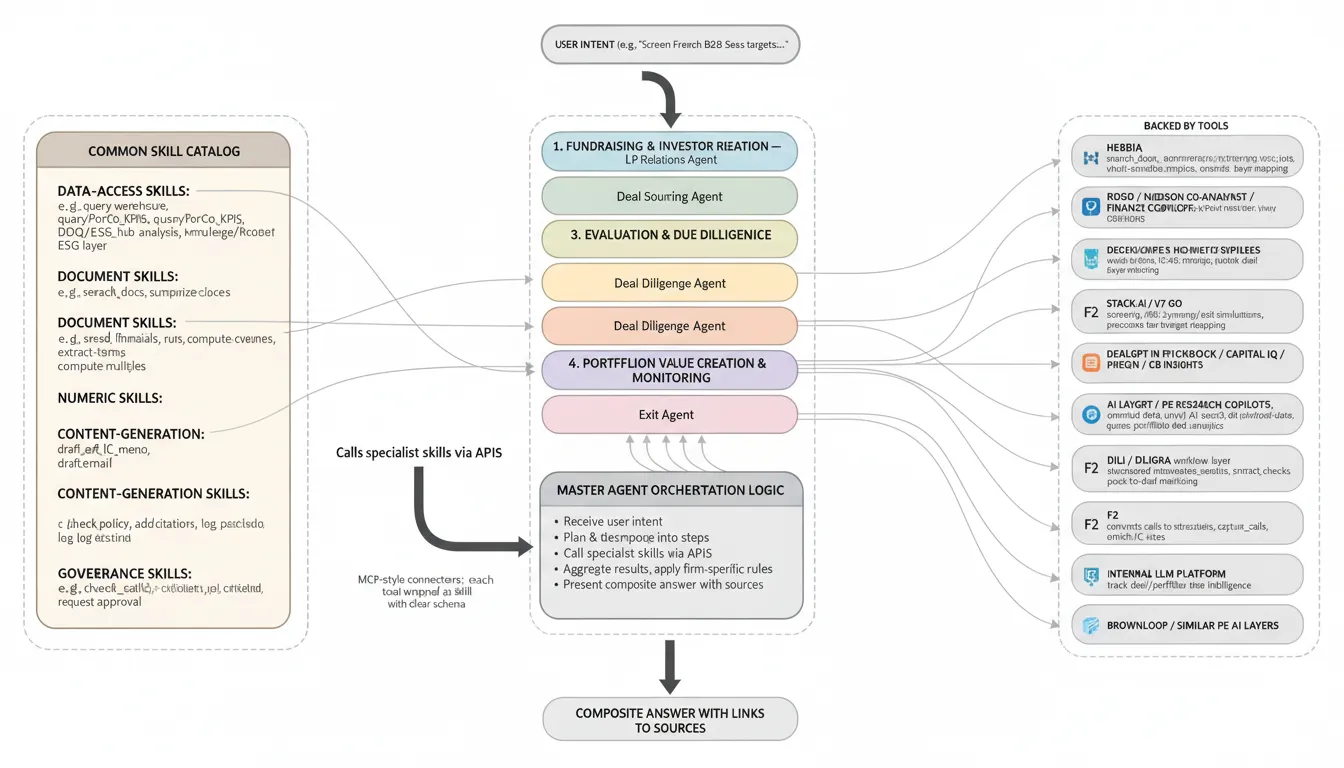
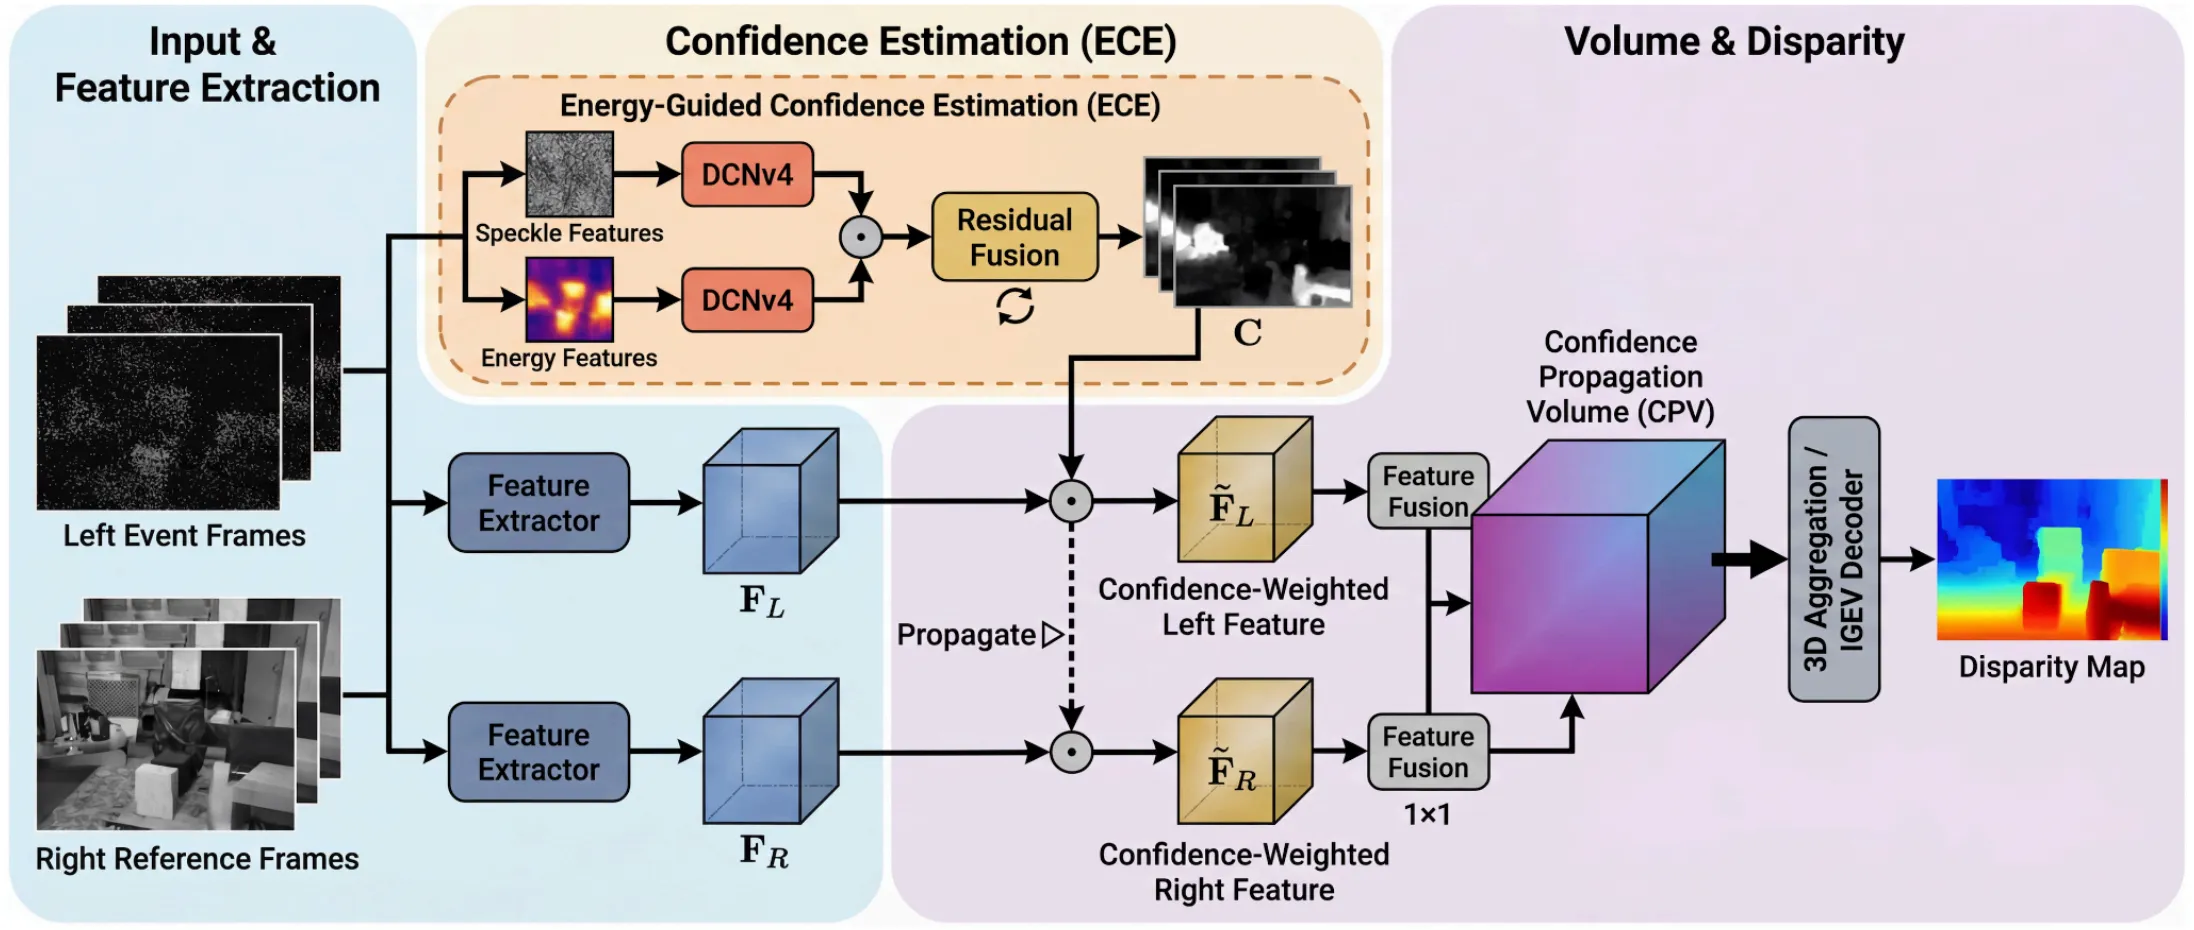
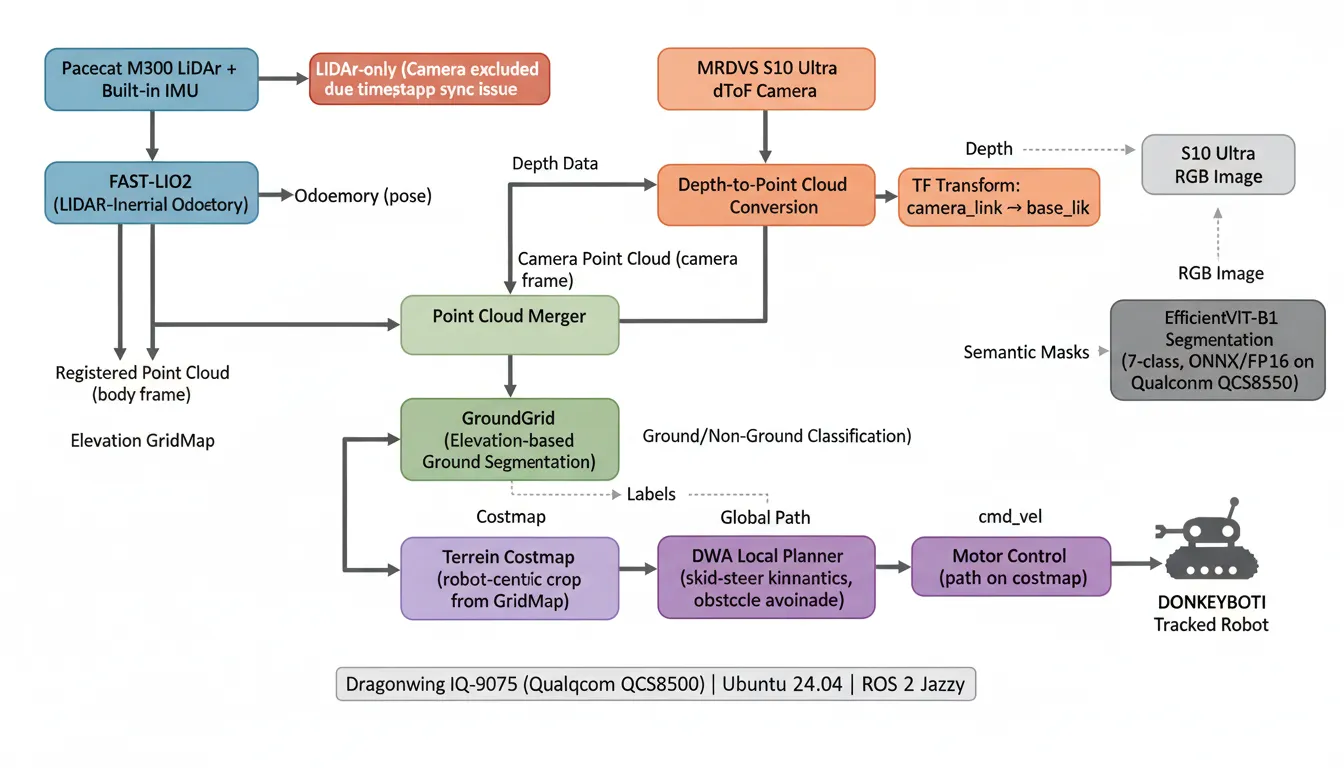
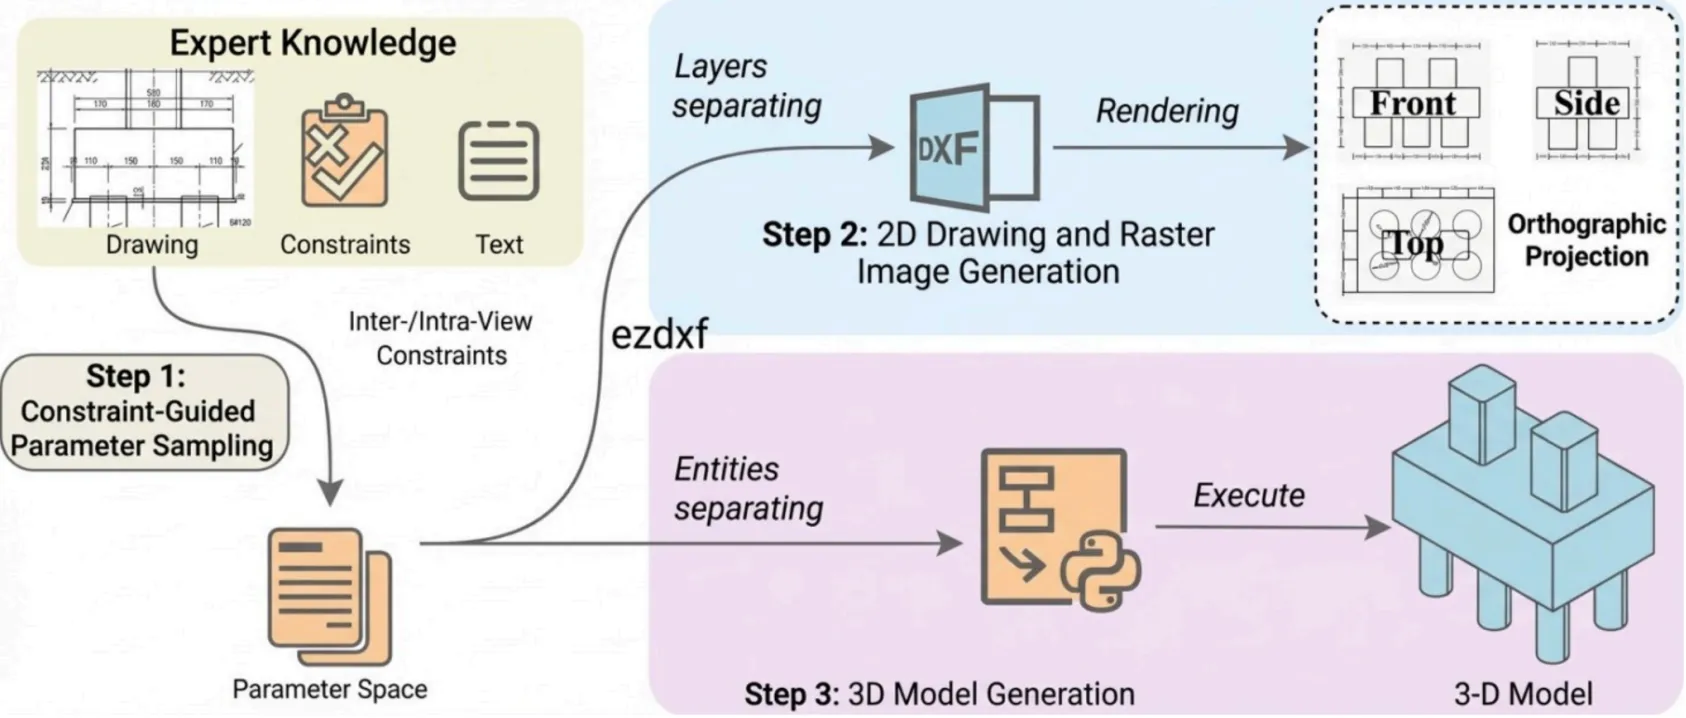
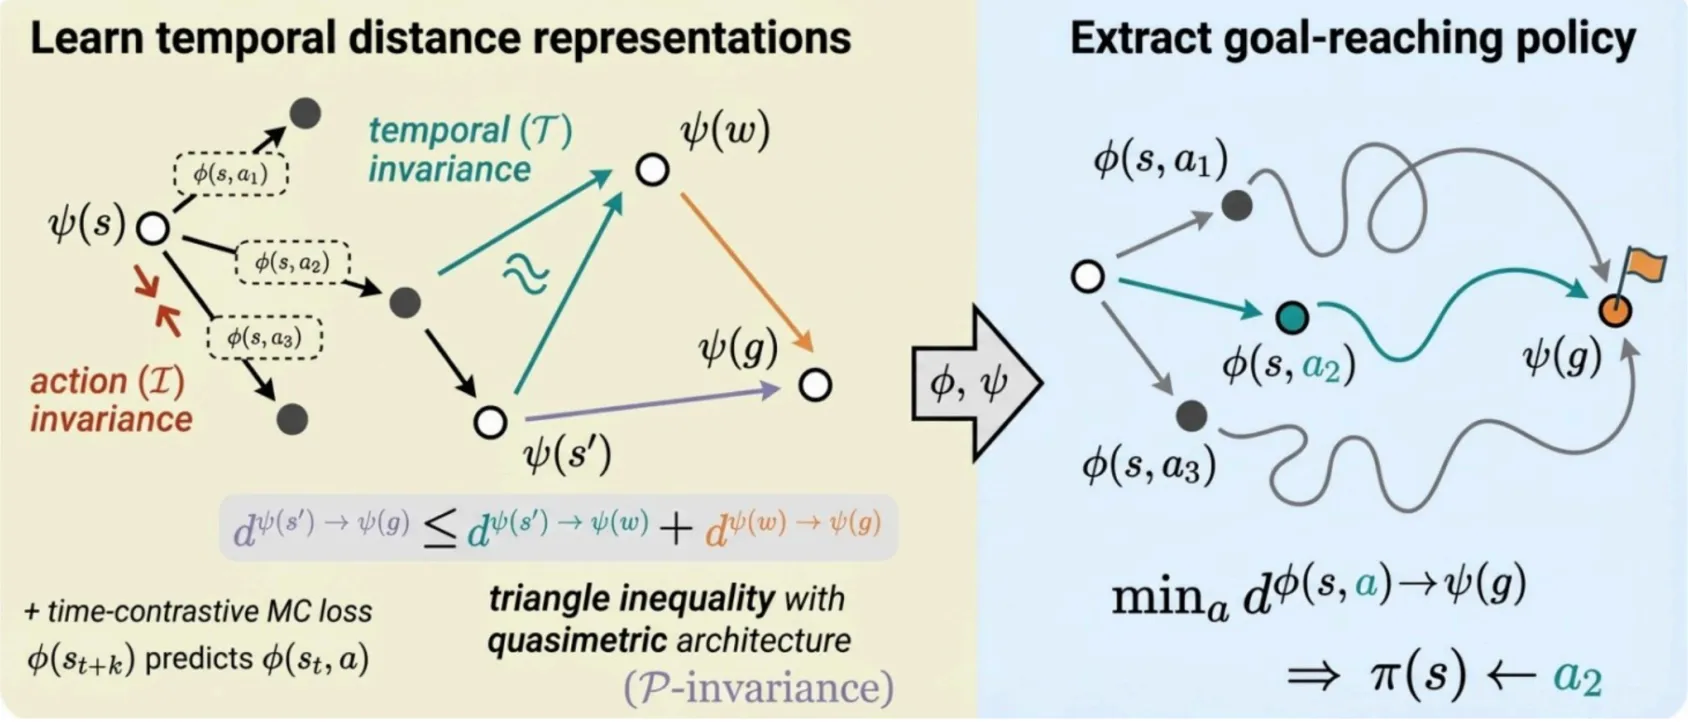
Turn dense descriptions of modules, pipelines, and workflows into figures that communicate the system at a glance.
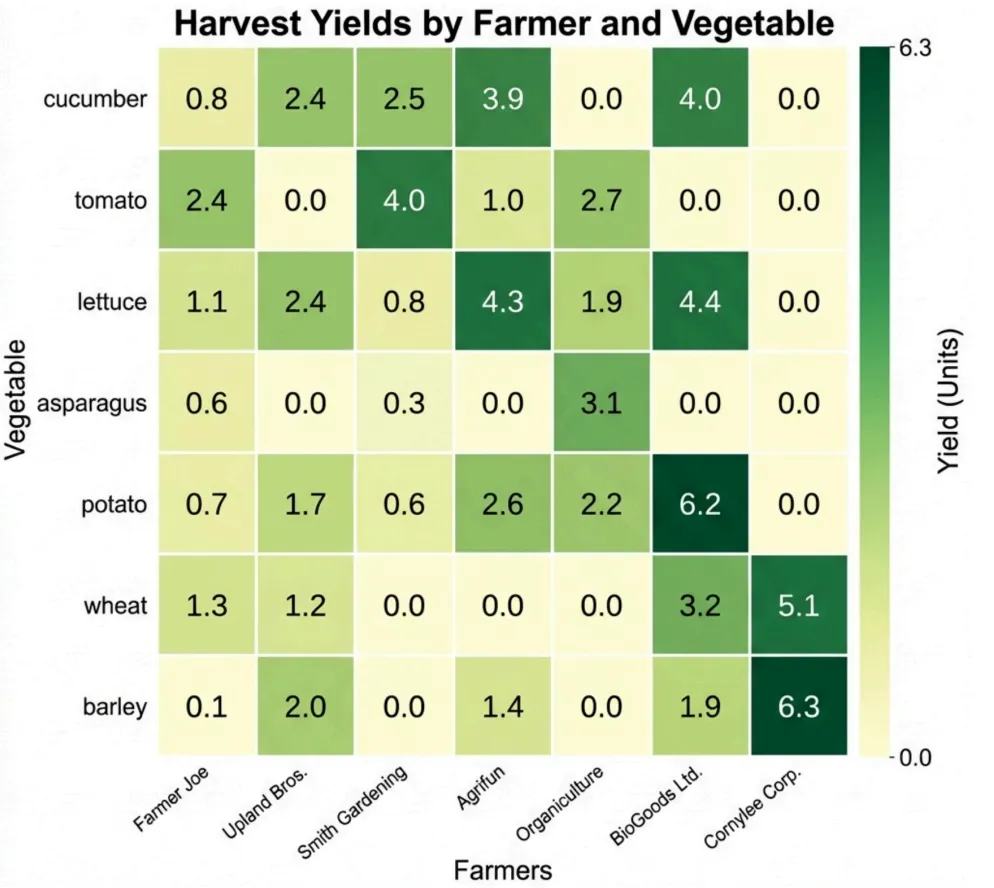
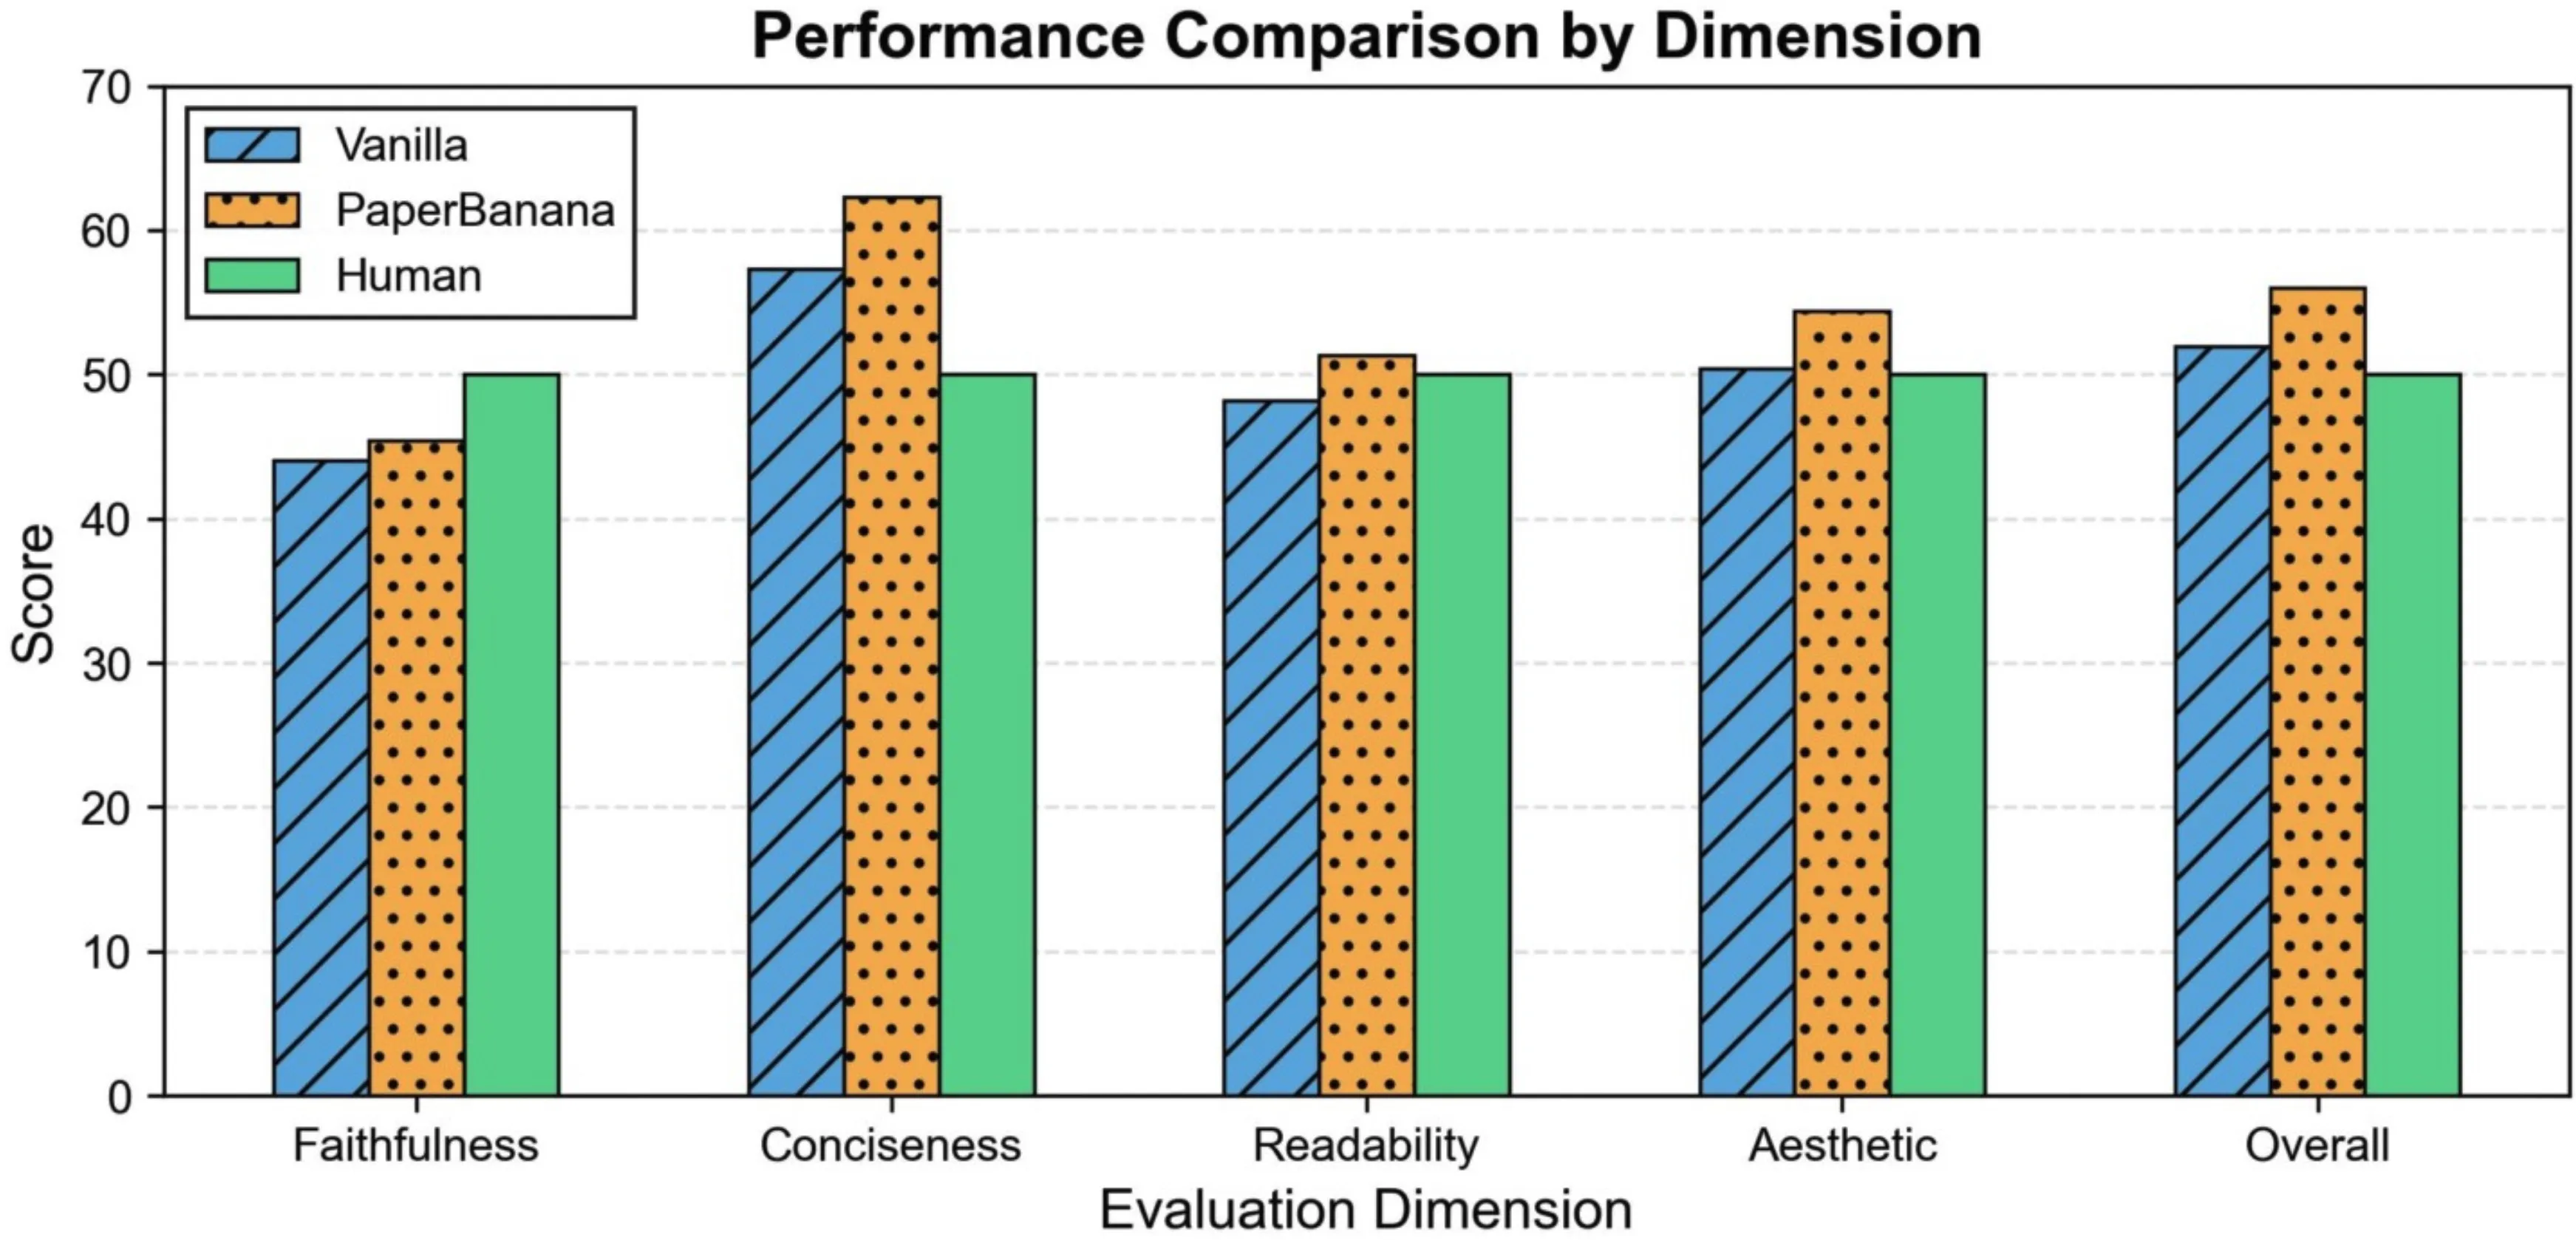
Use labeled arrays or structured values for charts, comparisons, curves, heatmaps, and other quantitative figures.
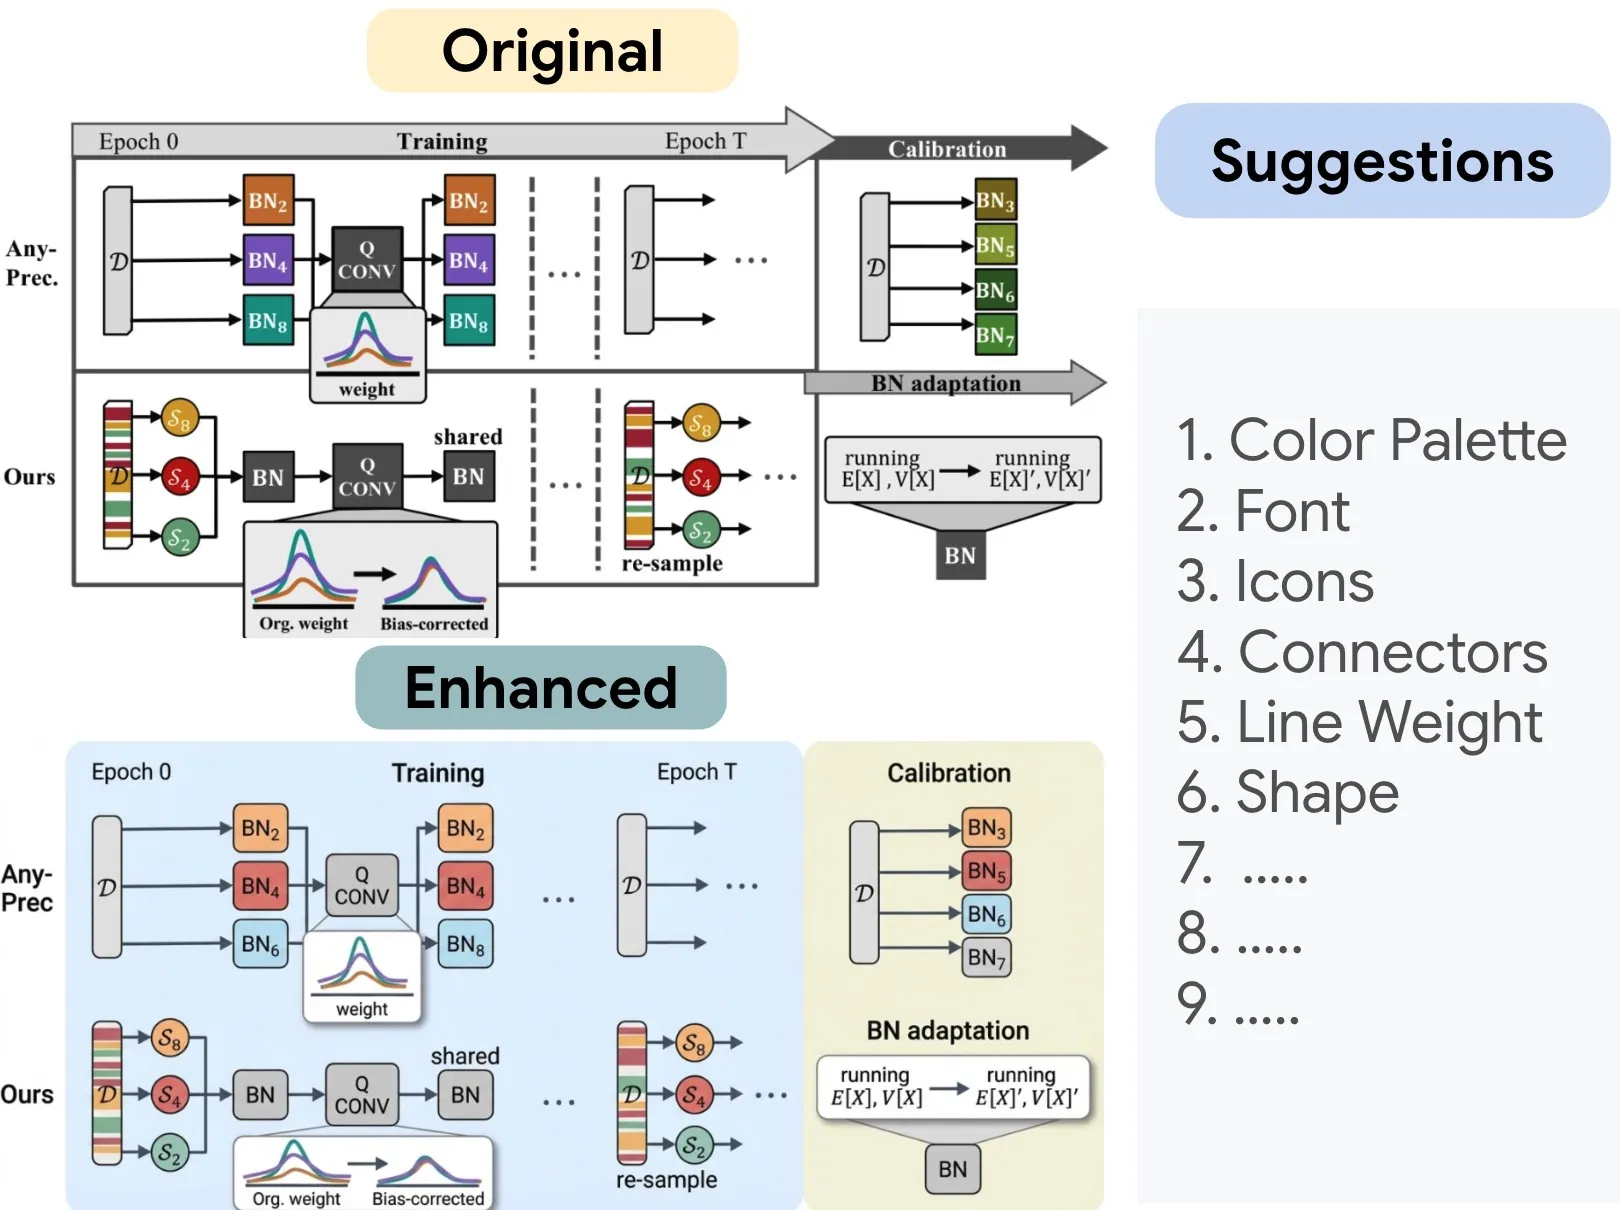
Upload draft diagrams, screenshots, or slide-style figures when the content is right but the presentation is not paper-ready.
What you get back
The goal is not just a pretty image. The goal is a figure that works inside a manuscript, rebuttal, poster, or presentation.
Methodology diagrams that explain architecture, data flow, and dependencies clearly
Statistical plots generated for quantitative results instead of decorative mockups
Cleaner figure sets with more consistent typography, spacing, arrows, and hierarchy