Five figure workflows
PaperBanana is built for the parts of figure work that usually slow papers down: explaining methods clearly, turning results into readable plots, rescuing weak visuals, and keeping an entire paper stylistically consistent.
Start a FigureWhat you can make
Each workflow is tuned for a different job in the paper-writing process, so you are not forcing one prompt style onto every kind of figure.
Methodology Diagrams
Turn dense method sections into readable system figures
Use this workflow when the paper needs architecture diagrams, pipelines, module interaction views, or process overviews. The goal is to make components, dependencies, and reading order immediately legible.
Example Jobs
- Model architecture overviews
- Training and inference pipelines
- RAG and agent workflows
- Module interaction diagrams
Statistical Plots
Generate result figures from structured data
Best for bar charts, line charts, scatter plots, heatmaps, confusion matrices, and other quantitative views. When numbers matter, PaperBanana can route plotting through executable chart logic instead of decorative image guessing.
Example Jobs
- Benchmark comparison charts
- Training curves and ablations
- Heatmaps and confusion matrices
- Multi-series result summaries
Figure Cleanup
Rebuild blurry, inconsistent, or slide-like visuals
Useful when a draft figure technically says the right thing but still looks out of place in a paper. Clean lines, tighter hierarchy, better spacing, and typography that feels intentional instead of improvised.
Example Jobs
- PowerPoint figure cleanup
- Unifying figures from multiple co-authors
- Poster graphic to paper figure conversion
- Low-quality screenshot reconstruction
Teaching and Survey Visuals
Explain concepts, mechanisms, and background clearly
Use this mode for tutorials, survey papers, course material, and onboarding documents where clarity matters more than novelty. It is designed to make complex ideas easier to teach and easier to scan.
Example Jobs
- Concept explainer panels
- Survey process diagrams
- Course and seminar visuals
- Mechanism breakdowns
Venue-Aware Refinement
Tune the final look for the paper you are shipping
When the structure is already right, the remaining work is usually polish: color contrast, spacing, font scale, arrows, legends, and visual balance. Use this workflow for the last mile before submission.
Example Jobs
- NeurIPS-style cleanup
- Nature-style simplification
- Camera-ready polish passes
- Consistent figure-set finishing
Details that matter in a paper
The difference between a usable figure and a decorative one usually shows up in these smaller decisions.
Relationships, grouping, directionality, and reading order stay central instead of getting buried under styling effects.
Keep a shared visual language across architecture diagrams, plots, and explanation figures in the same manuscript.
When an advisor or reviewer asks for a change, generate a clearer variant instead of manually redrawing the whole figure.
High-resolution PNG output works for manuscripts, slides, posters, and submission decks without an extra cleanup pass.
What these workflows look like in practice
A few homepage examples, reused here to show the kinds of outputs these feature groups are meant to produce.
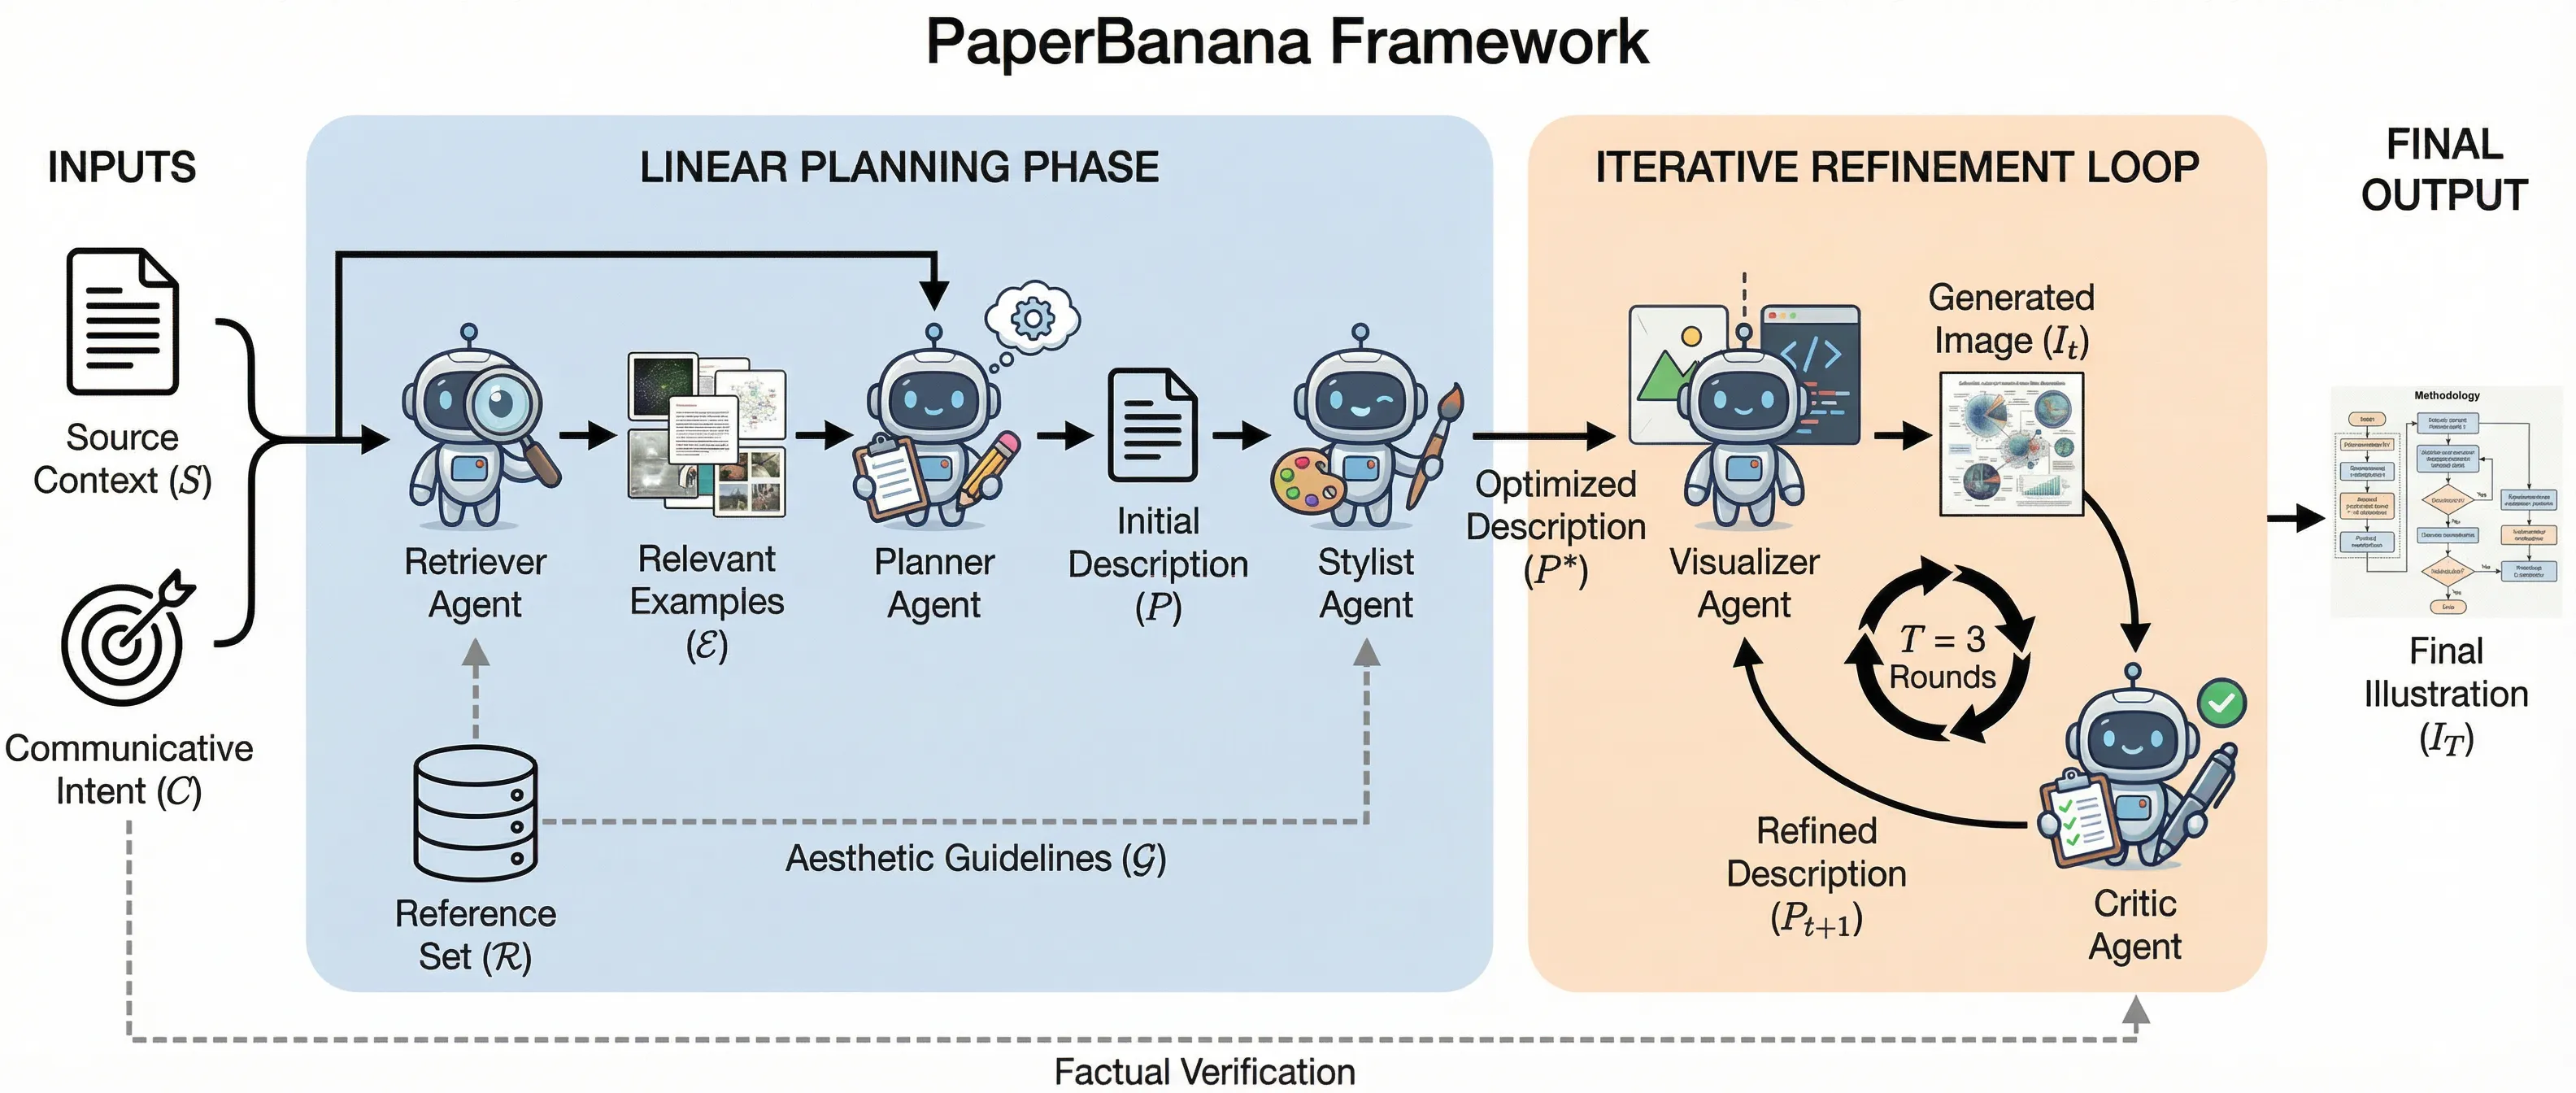
Multi-agent planning framework with iterative refinement loop
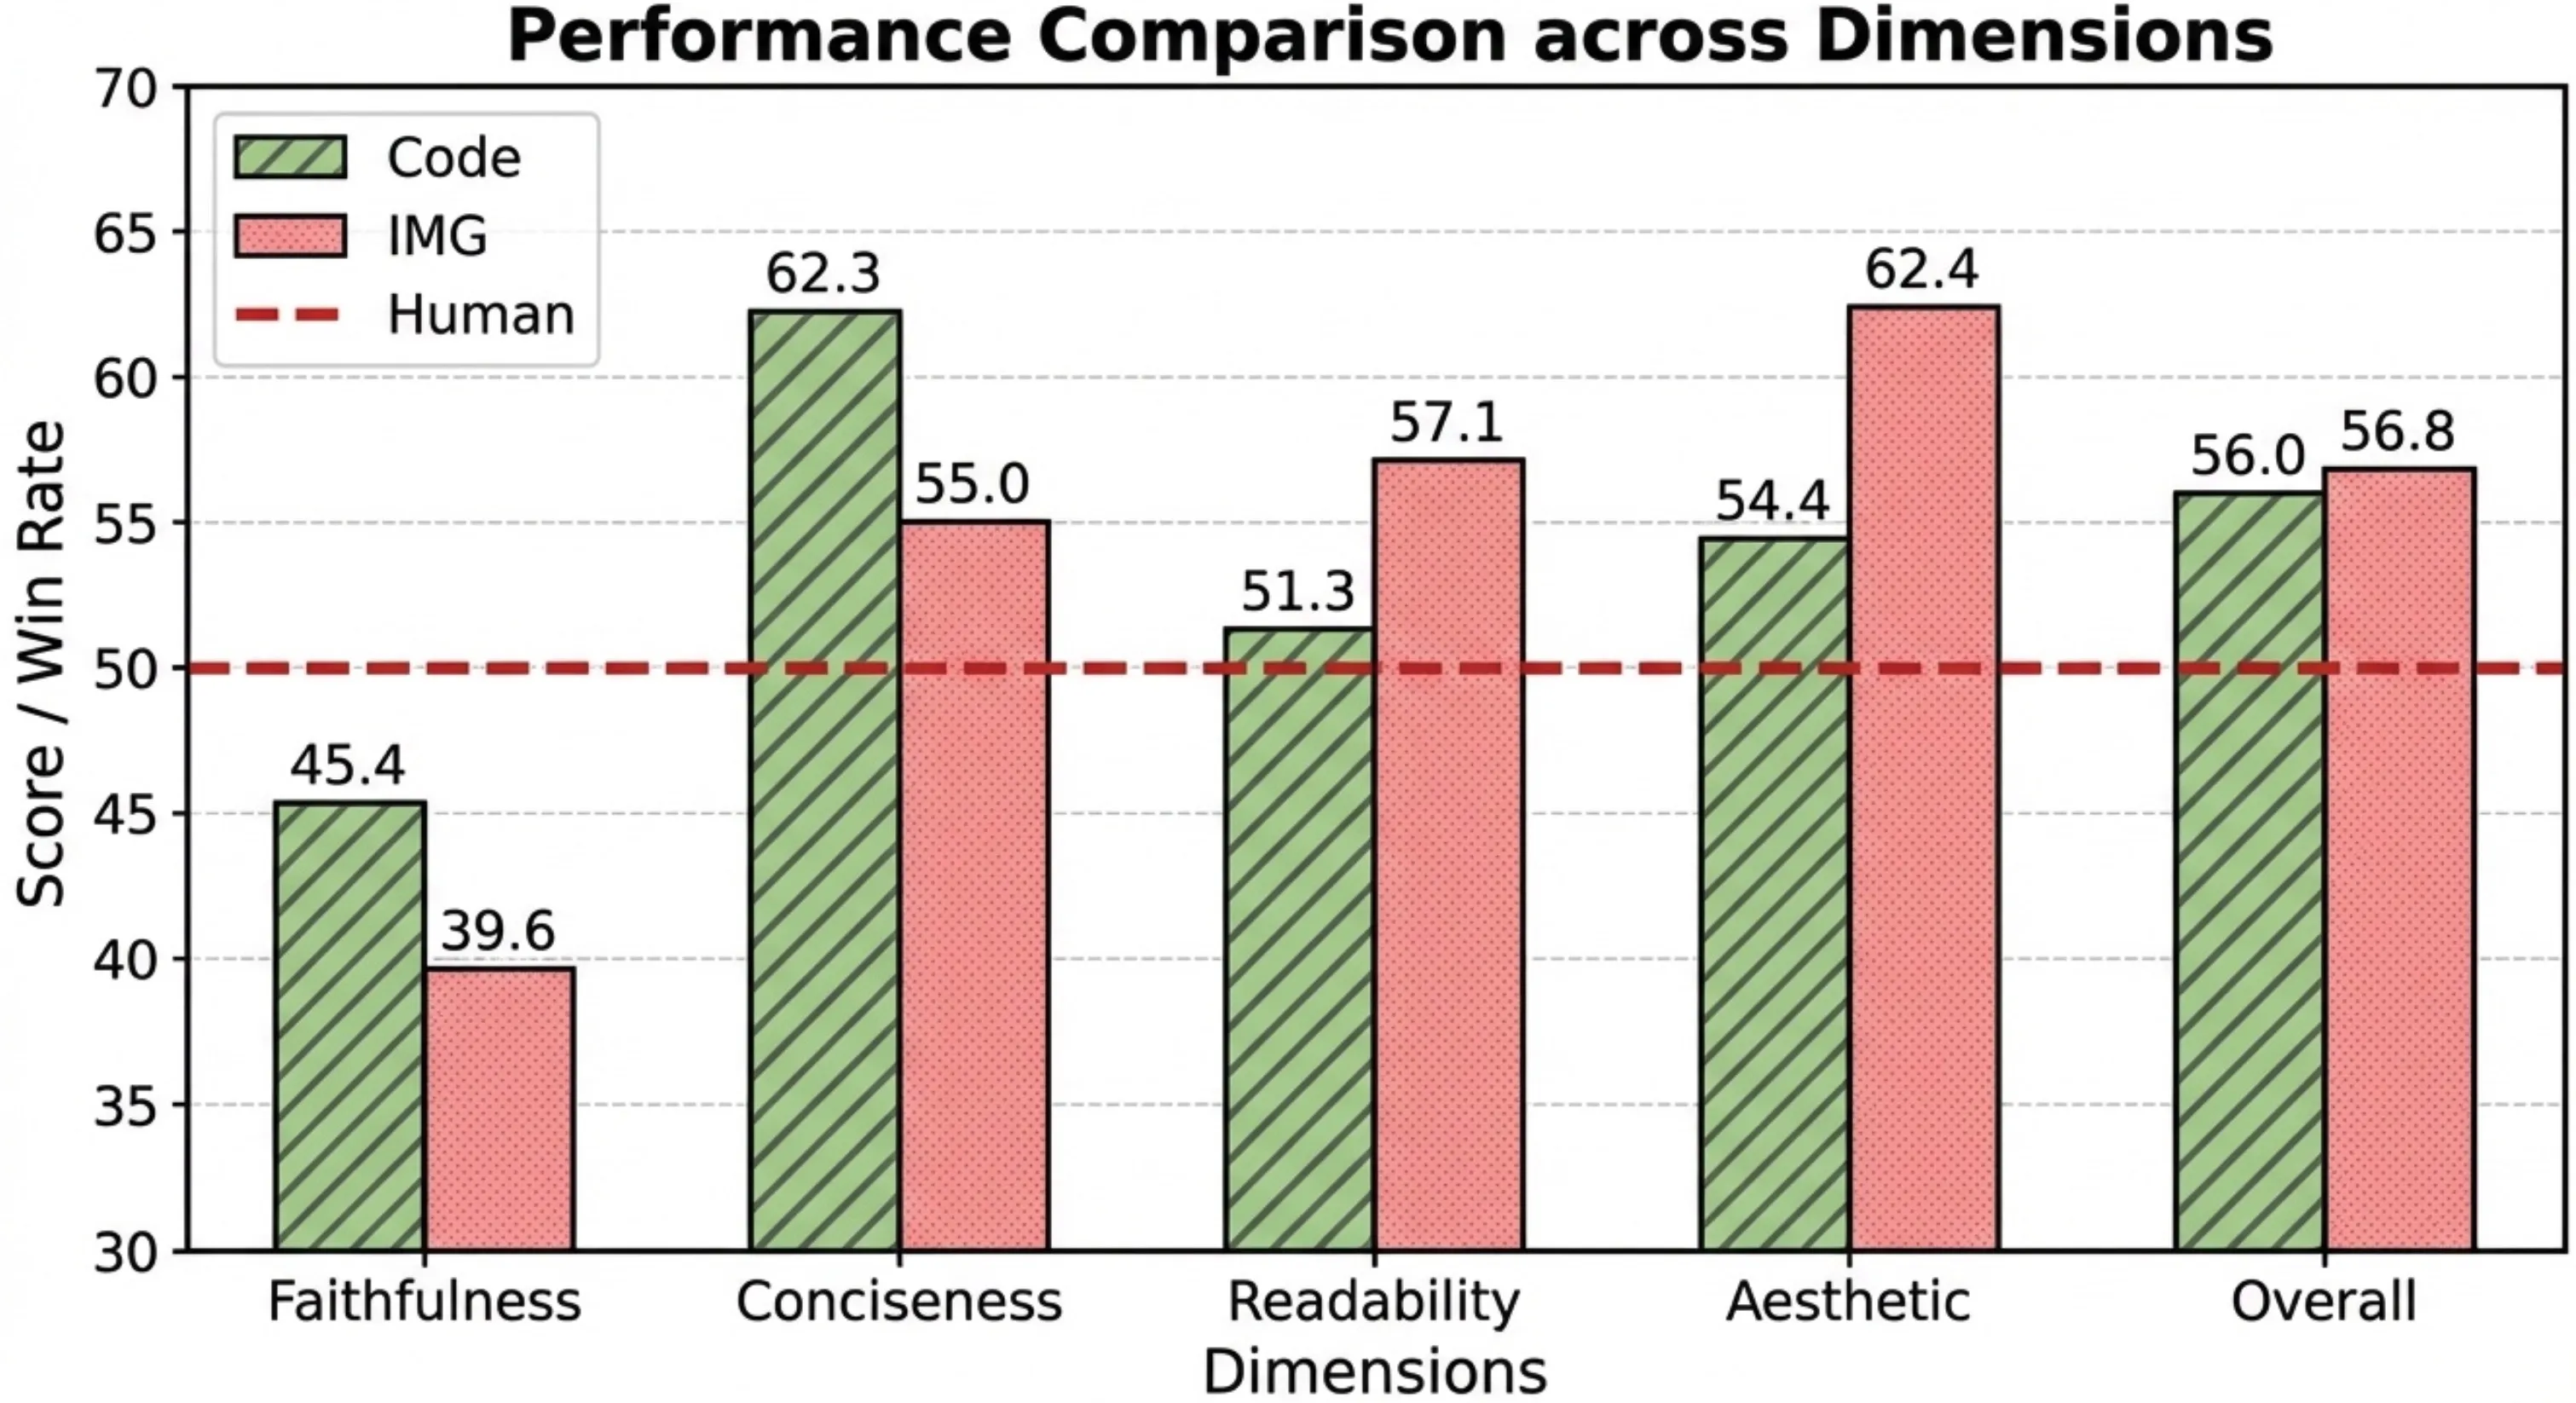
Performance comparison across coding and image dimensions
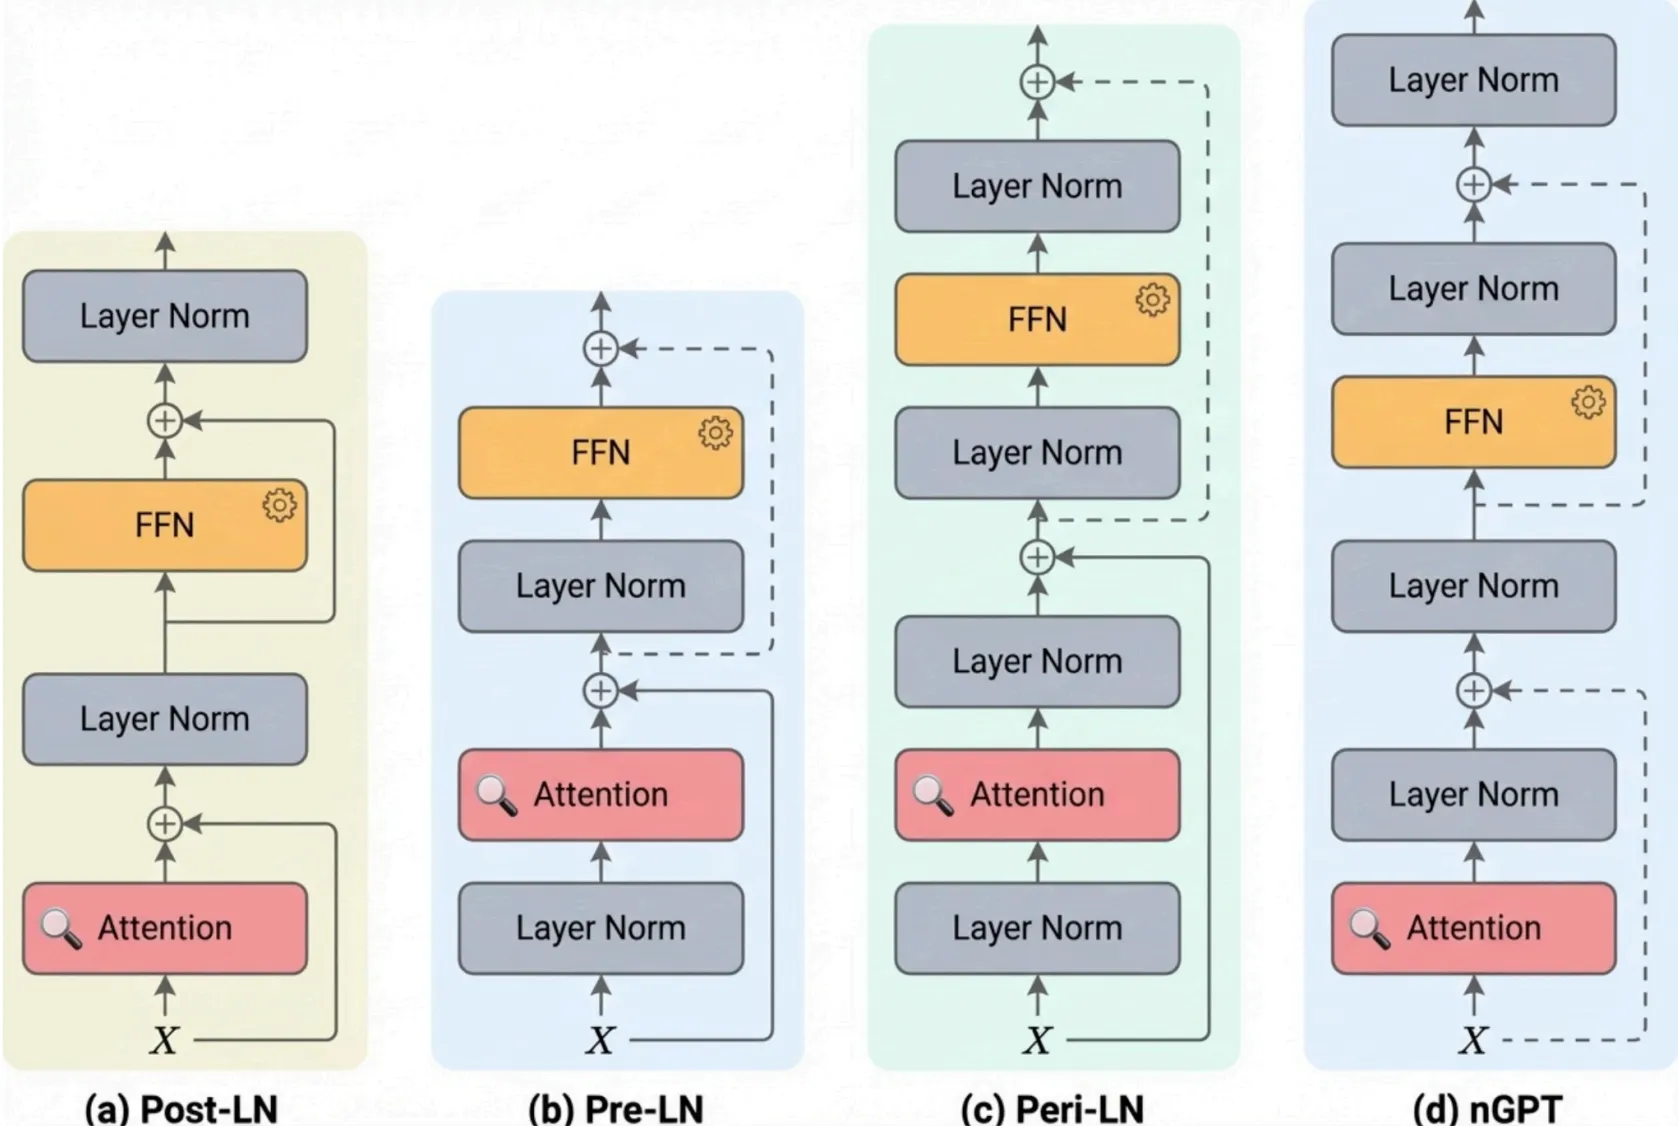
Aesthetically enhanced methodology diagram for publication
Manual figure work vs PaperBanana
The main difference is not just speed. It is whether your figures evolve with the paper or have to be rebuilt around it.
Typical manual workflow
- Each figure is drawn in a different tool and drifts into a different style
- Small narrative changes trigger large redraws
- Result plots and method diagrams live in separate workflows
- Visual cleanup gets pushed to the final days before submission
- Figures often look added on instead of integrated into the paper's argument
With PaperBanana
- Use one workflow across method figures, result figures, and explanation visuals
- Generate alternatives quickly when the story or layout changes
- Keep typography, spacing, and emphasis more consistent across the paper
- Move from rough draft visuals to camera-ready polish in the same tool
- Produce figures that read like part of the research instead of presentation leftovers
Make the figures match the paper
Start with the figure type you need now, then iterate until it reads clearly enough to survive reviewer scrutiny.