Paper Banana:
Automating Academic Illustration
Turn methodology text and experimental data into publication-ready figures instantly. Powered by a 5-agent AI pipeline — no Illustrator, no TikZ, no wasted hours.
Create NowSamples
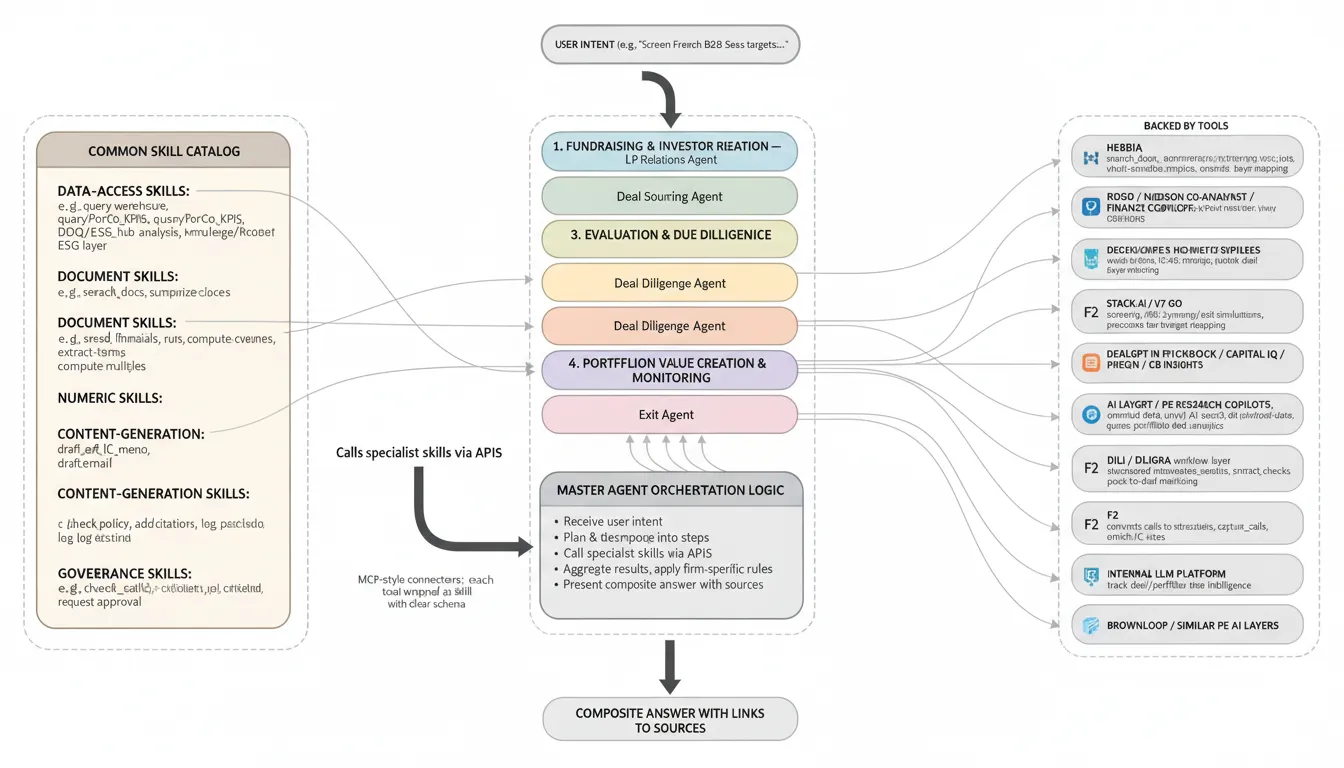
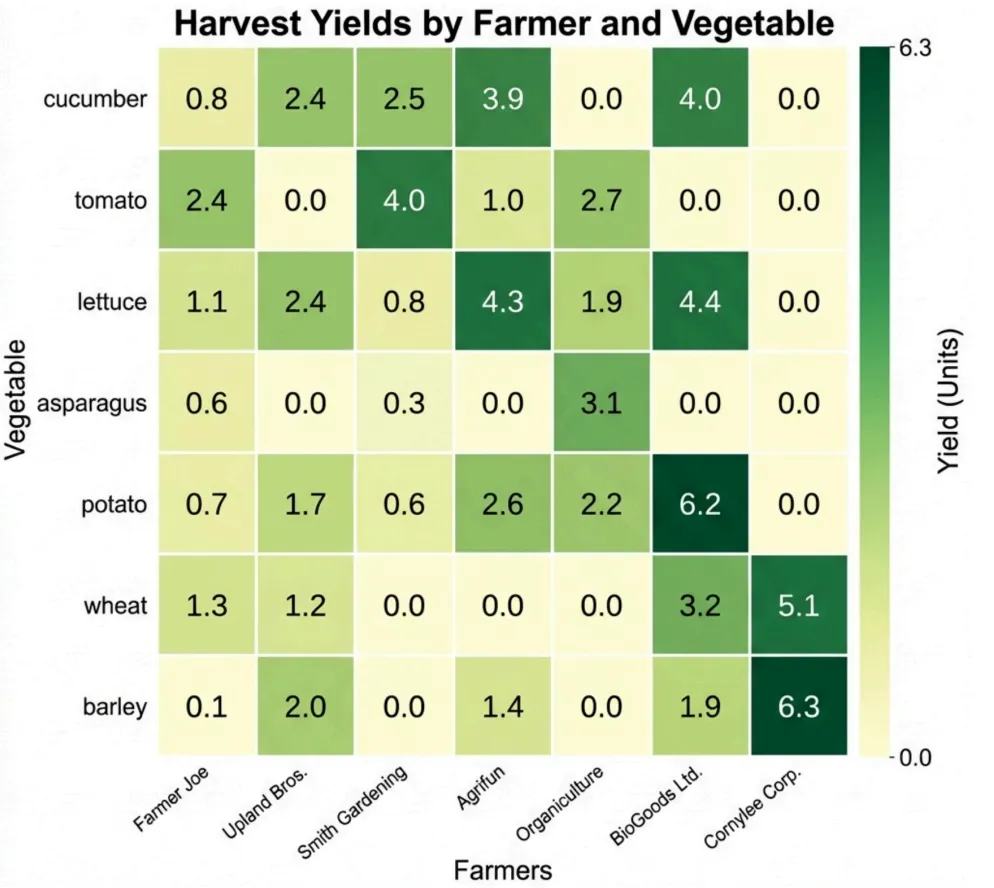
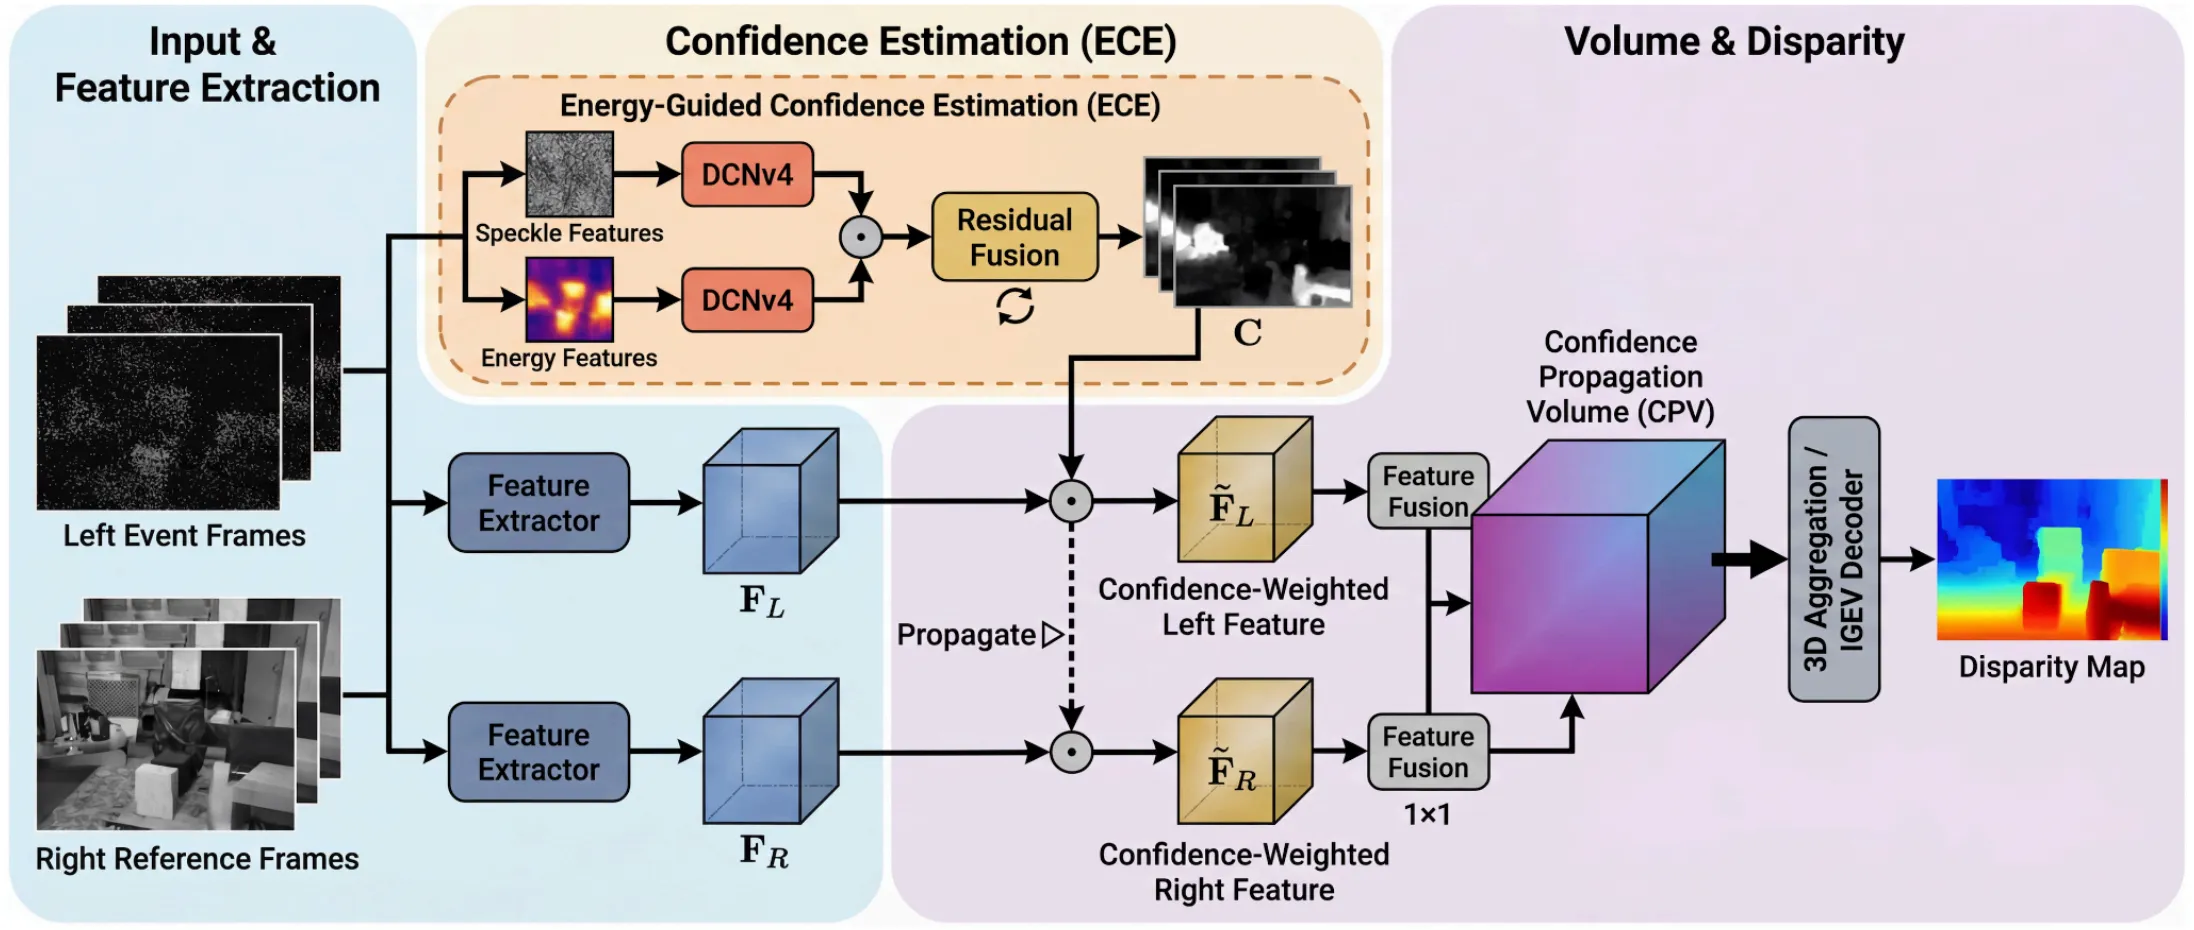
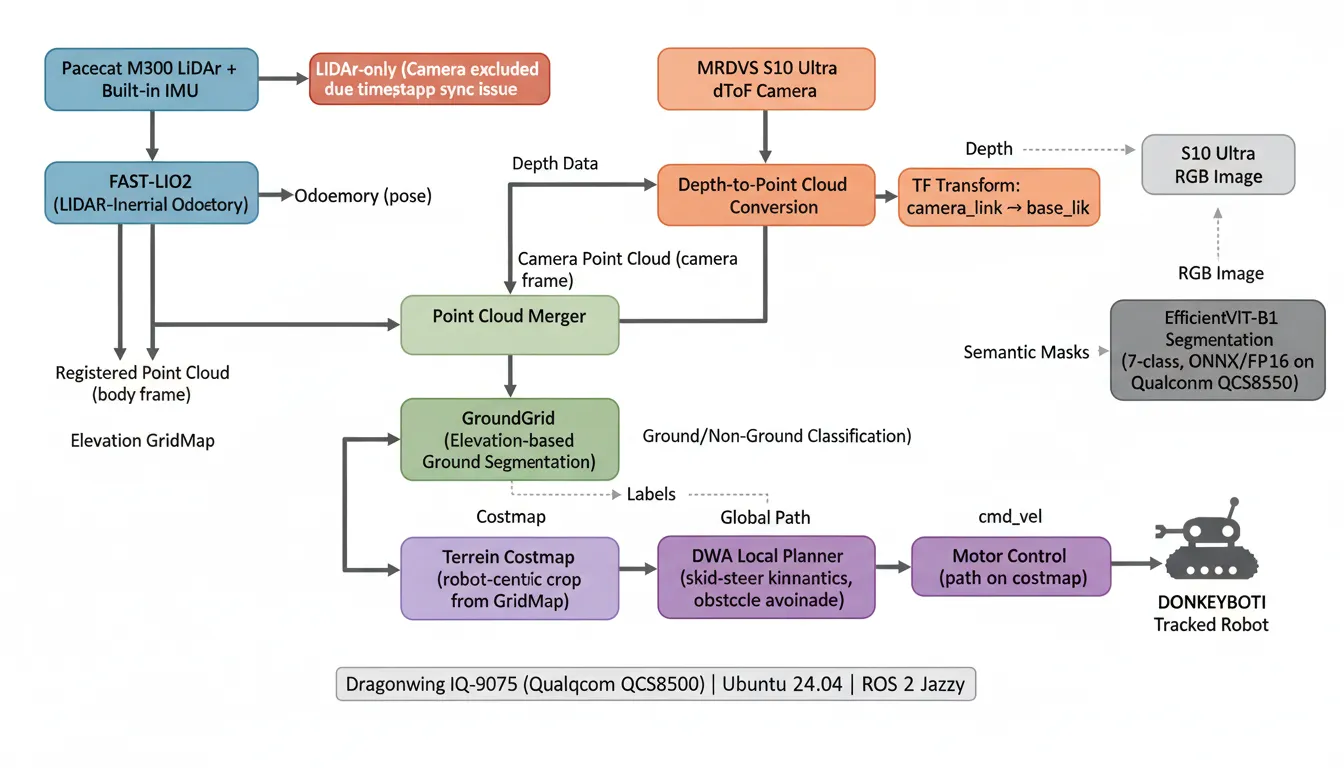
Created with Paper Banana
See what researchers are generating with Paper Banana's AI academic figure tools
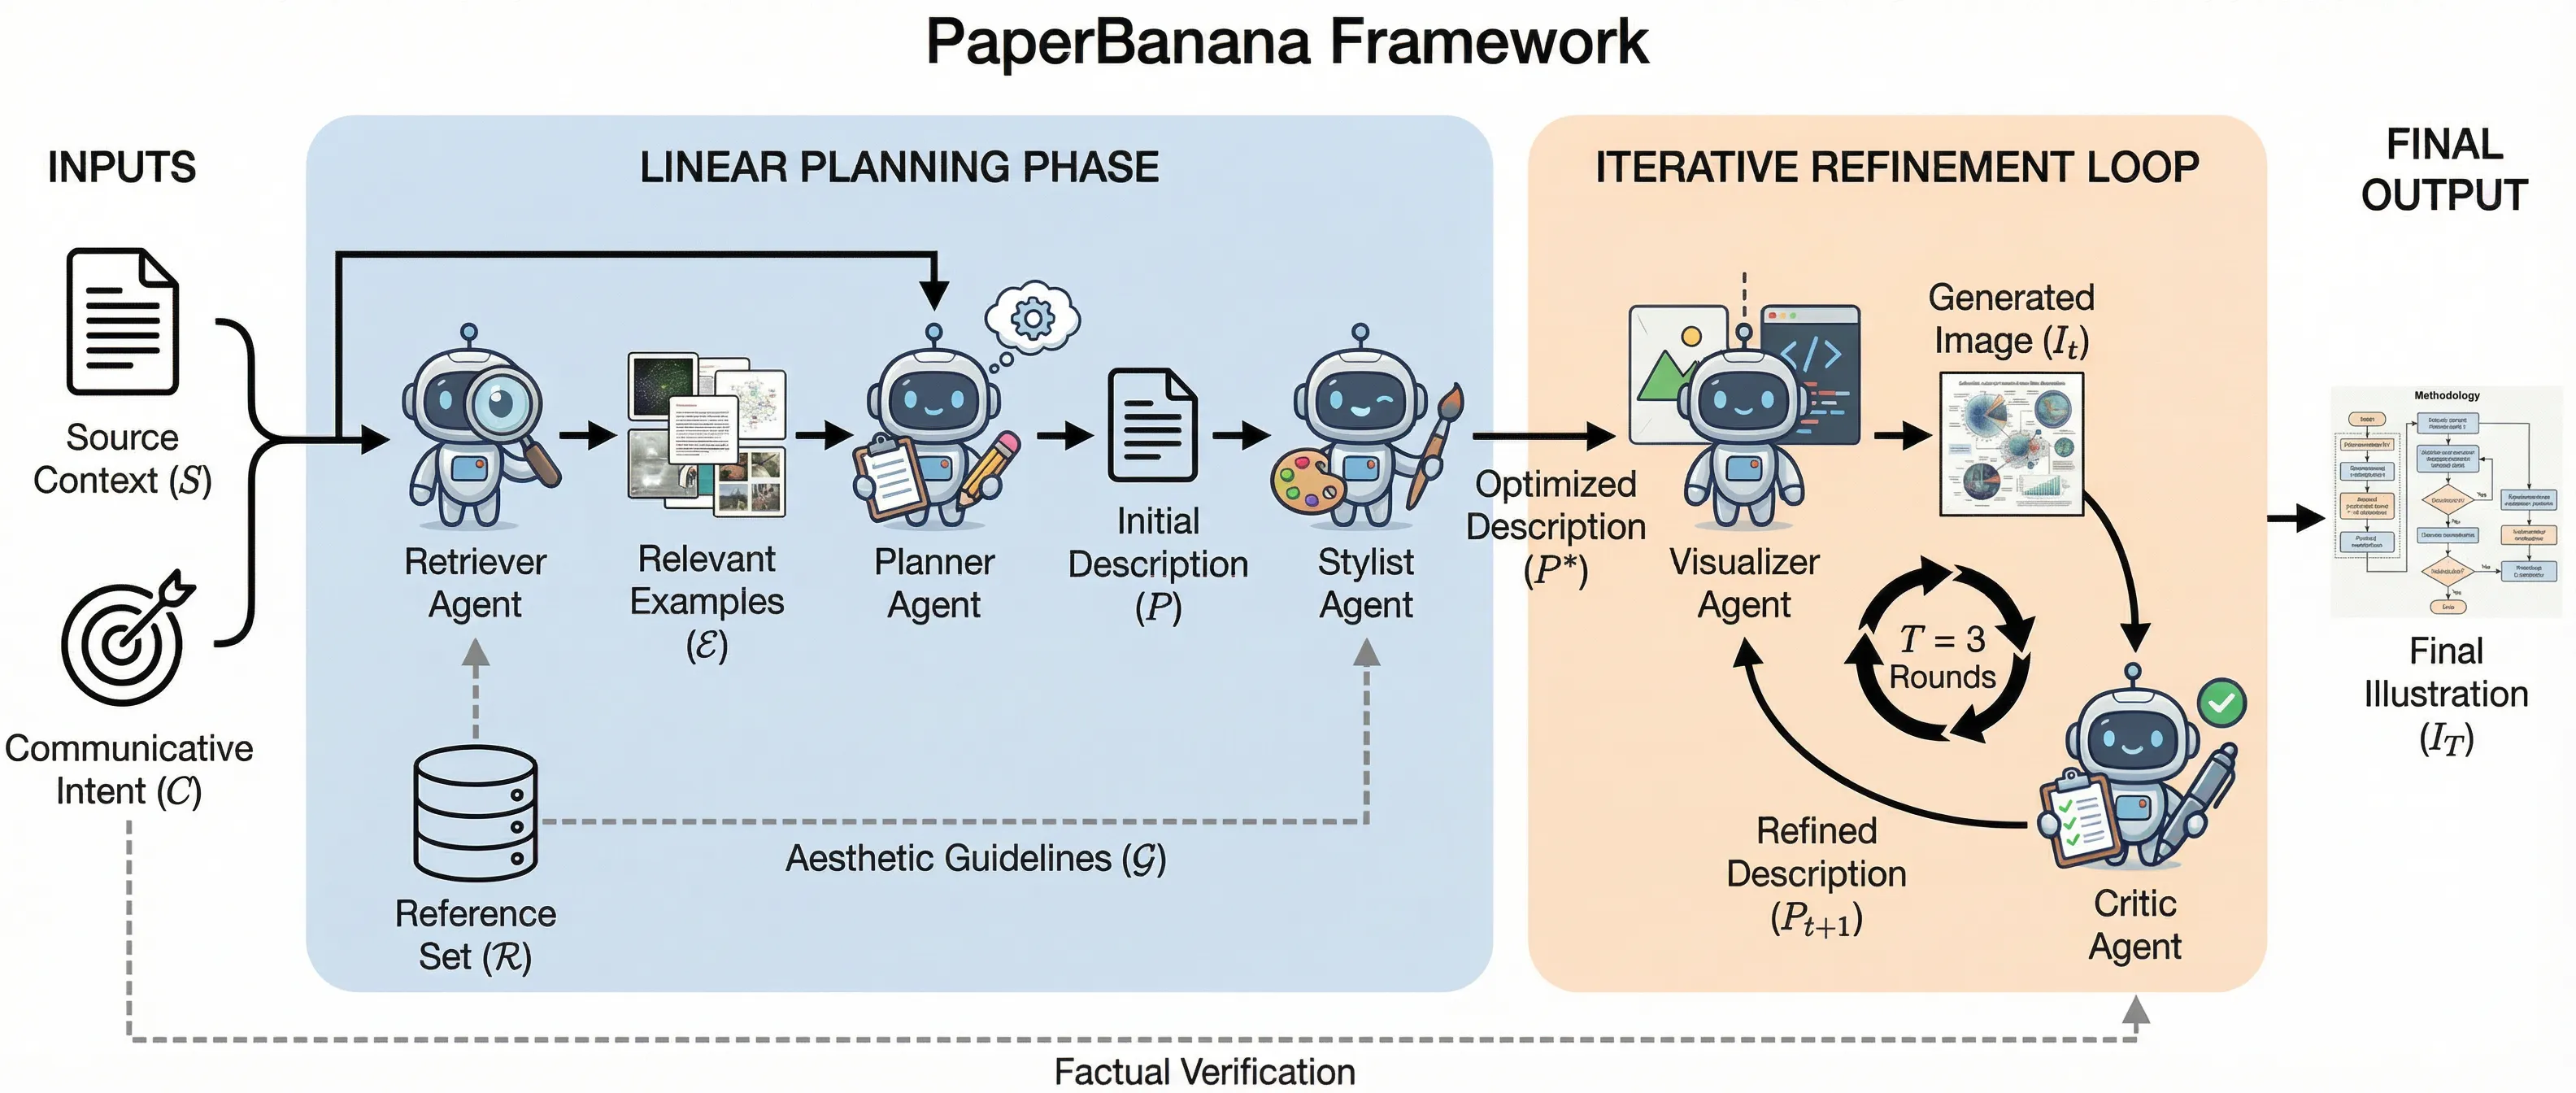
Multi-agent planning framework with iterative refinement loop
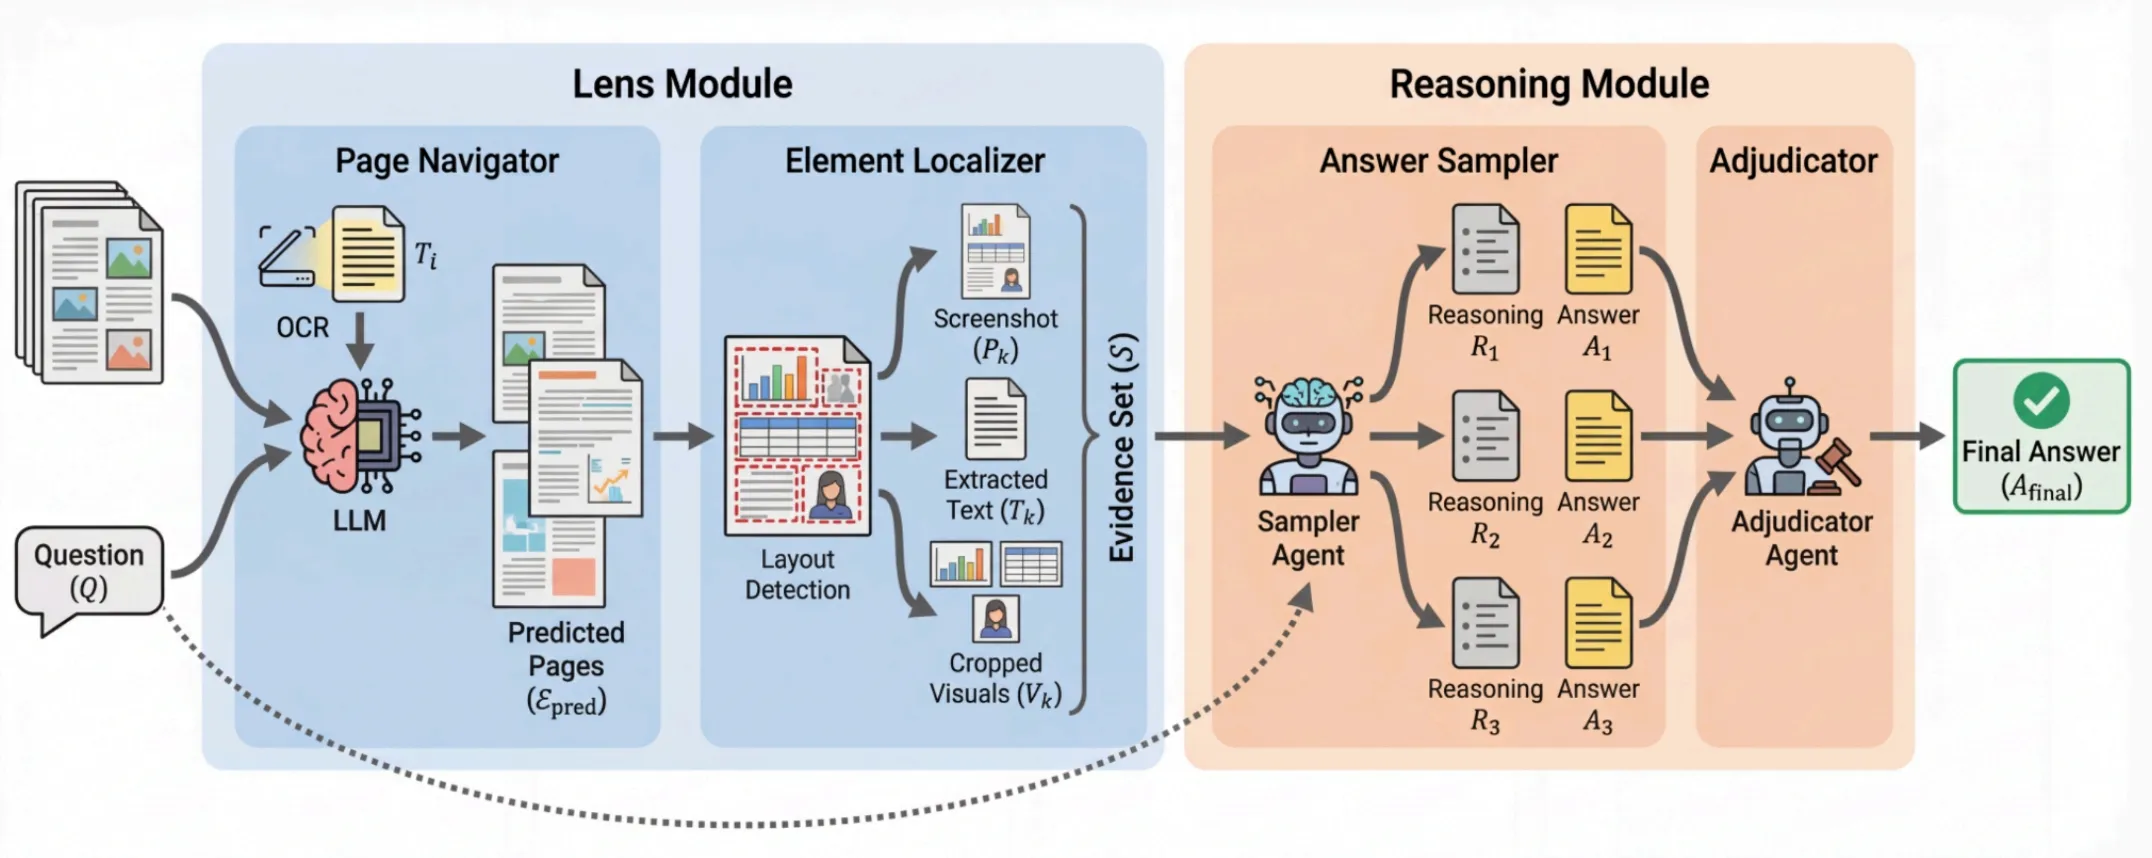
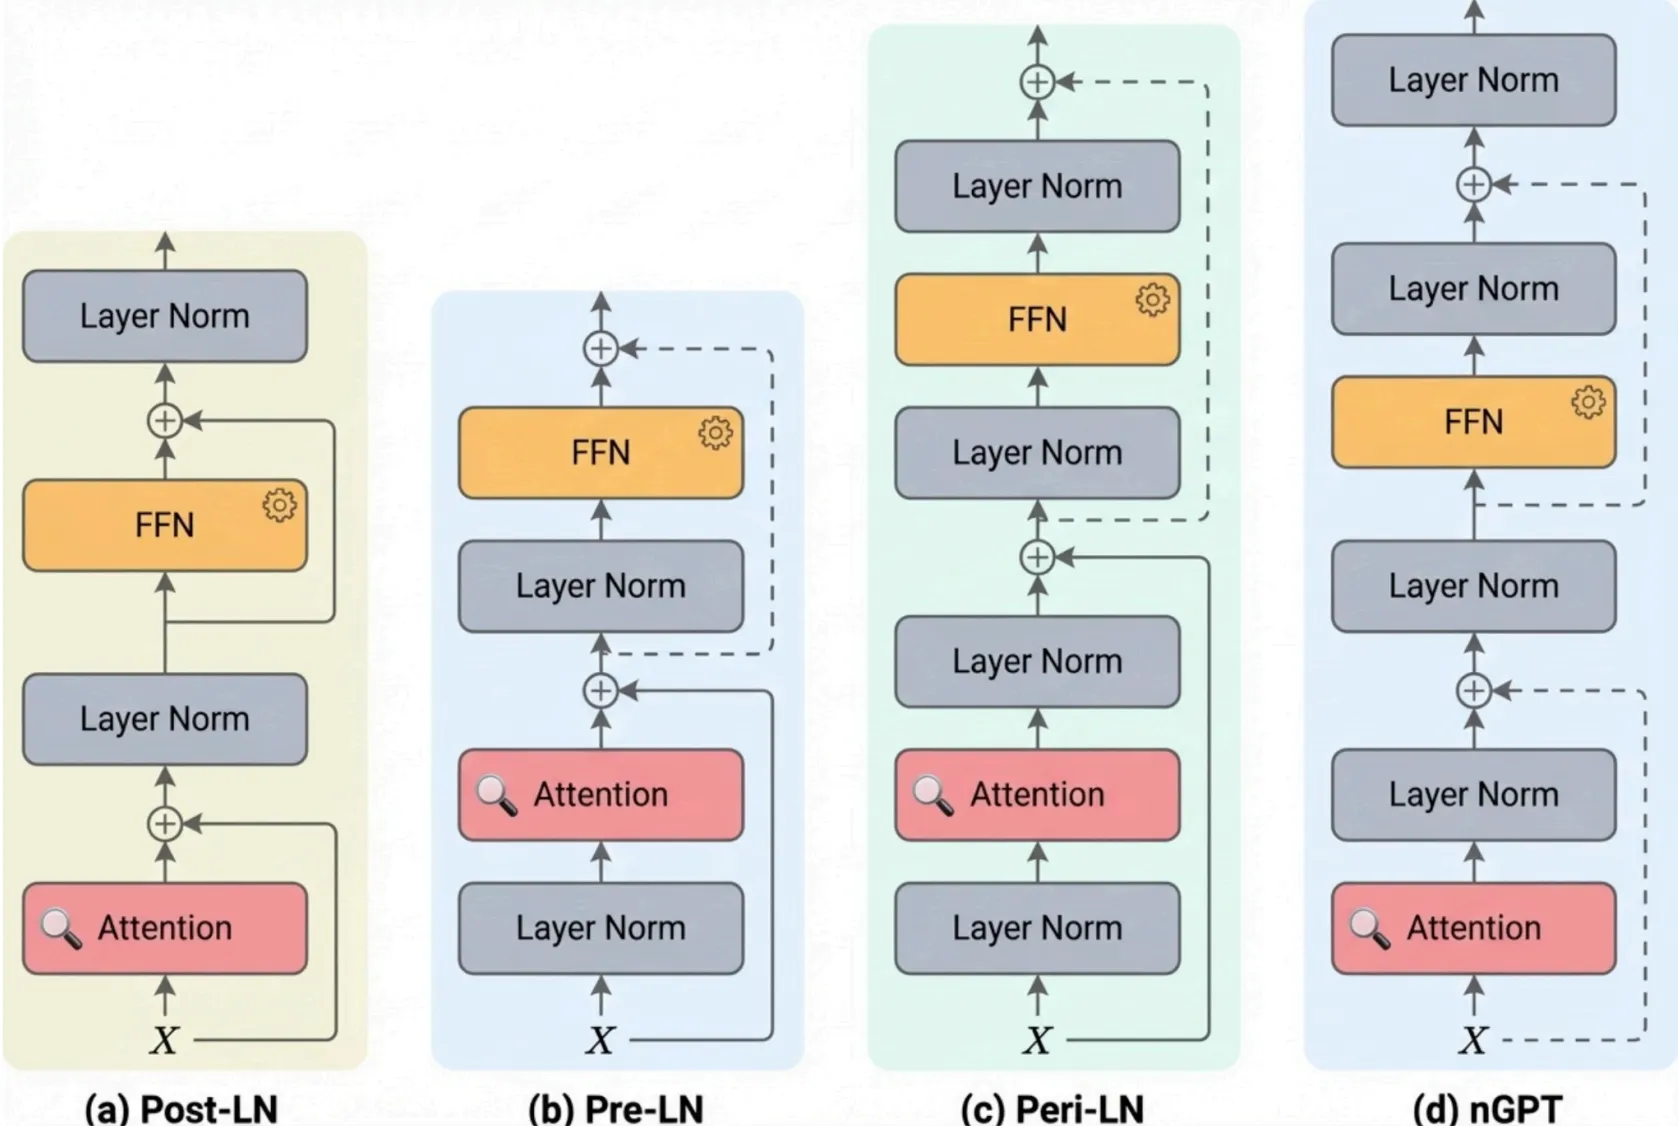
Lens module vs reasoning module architecture comparison
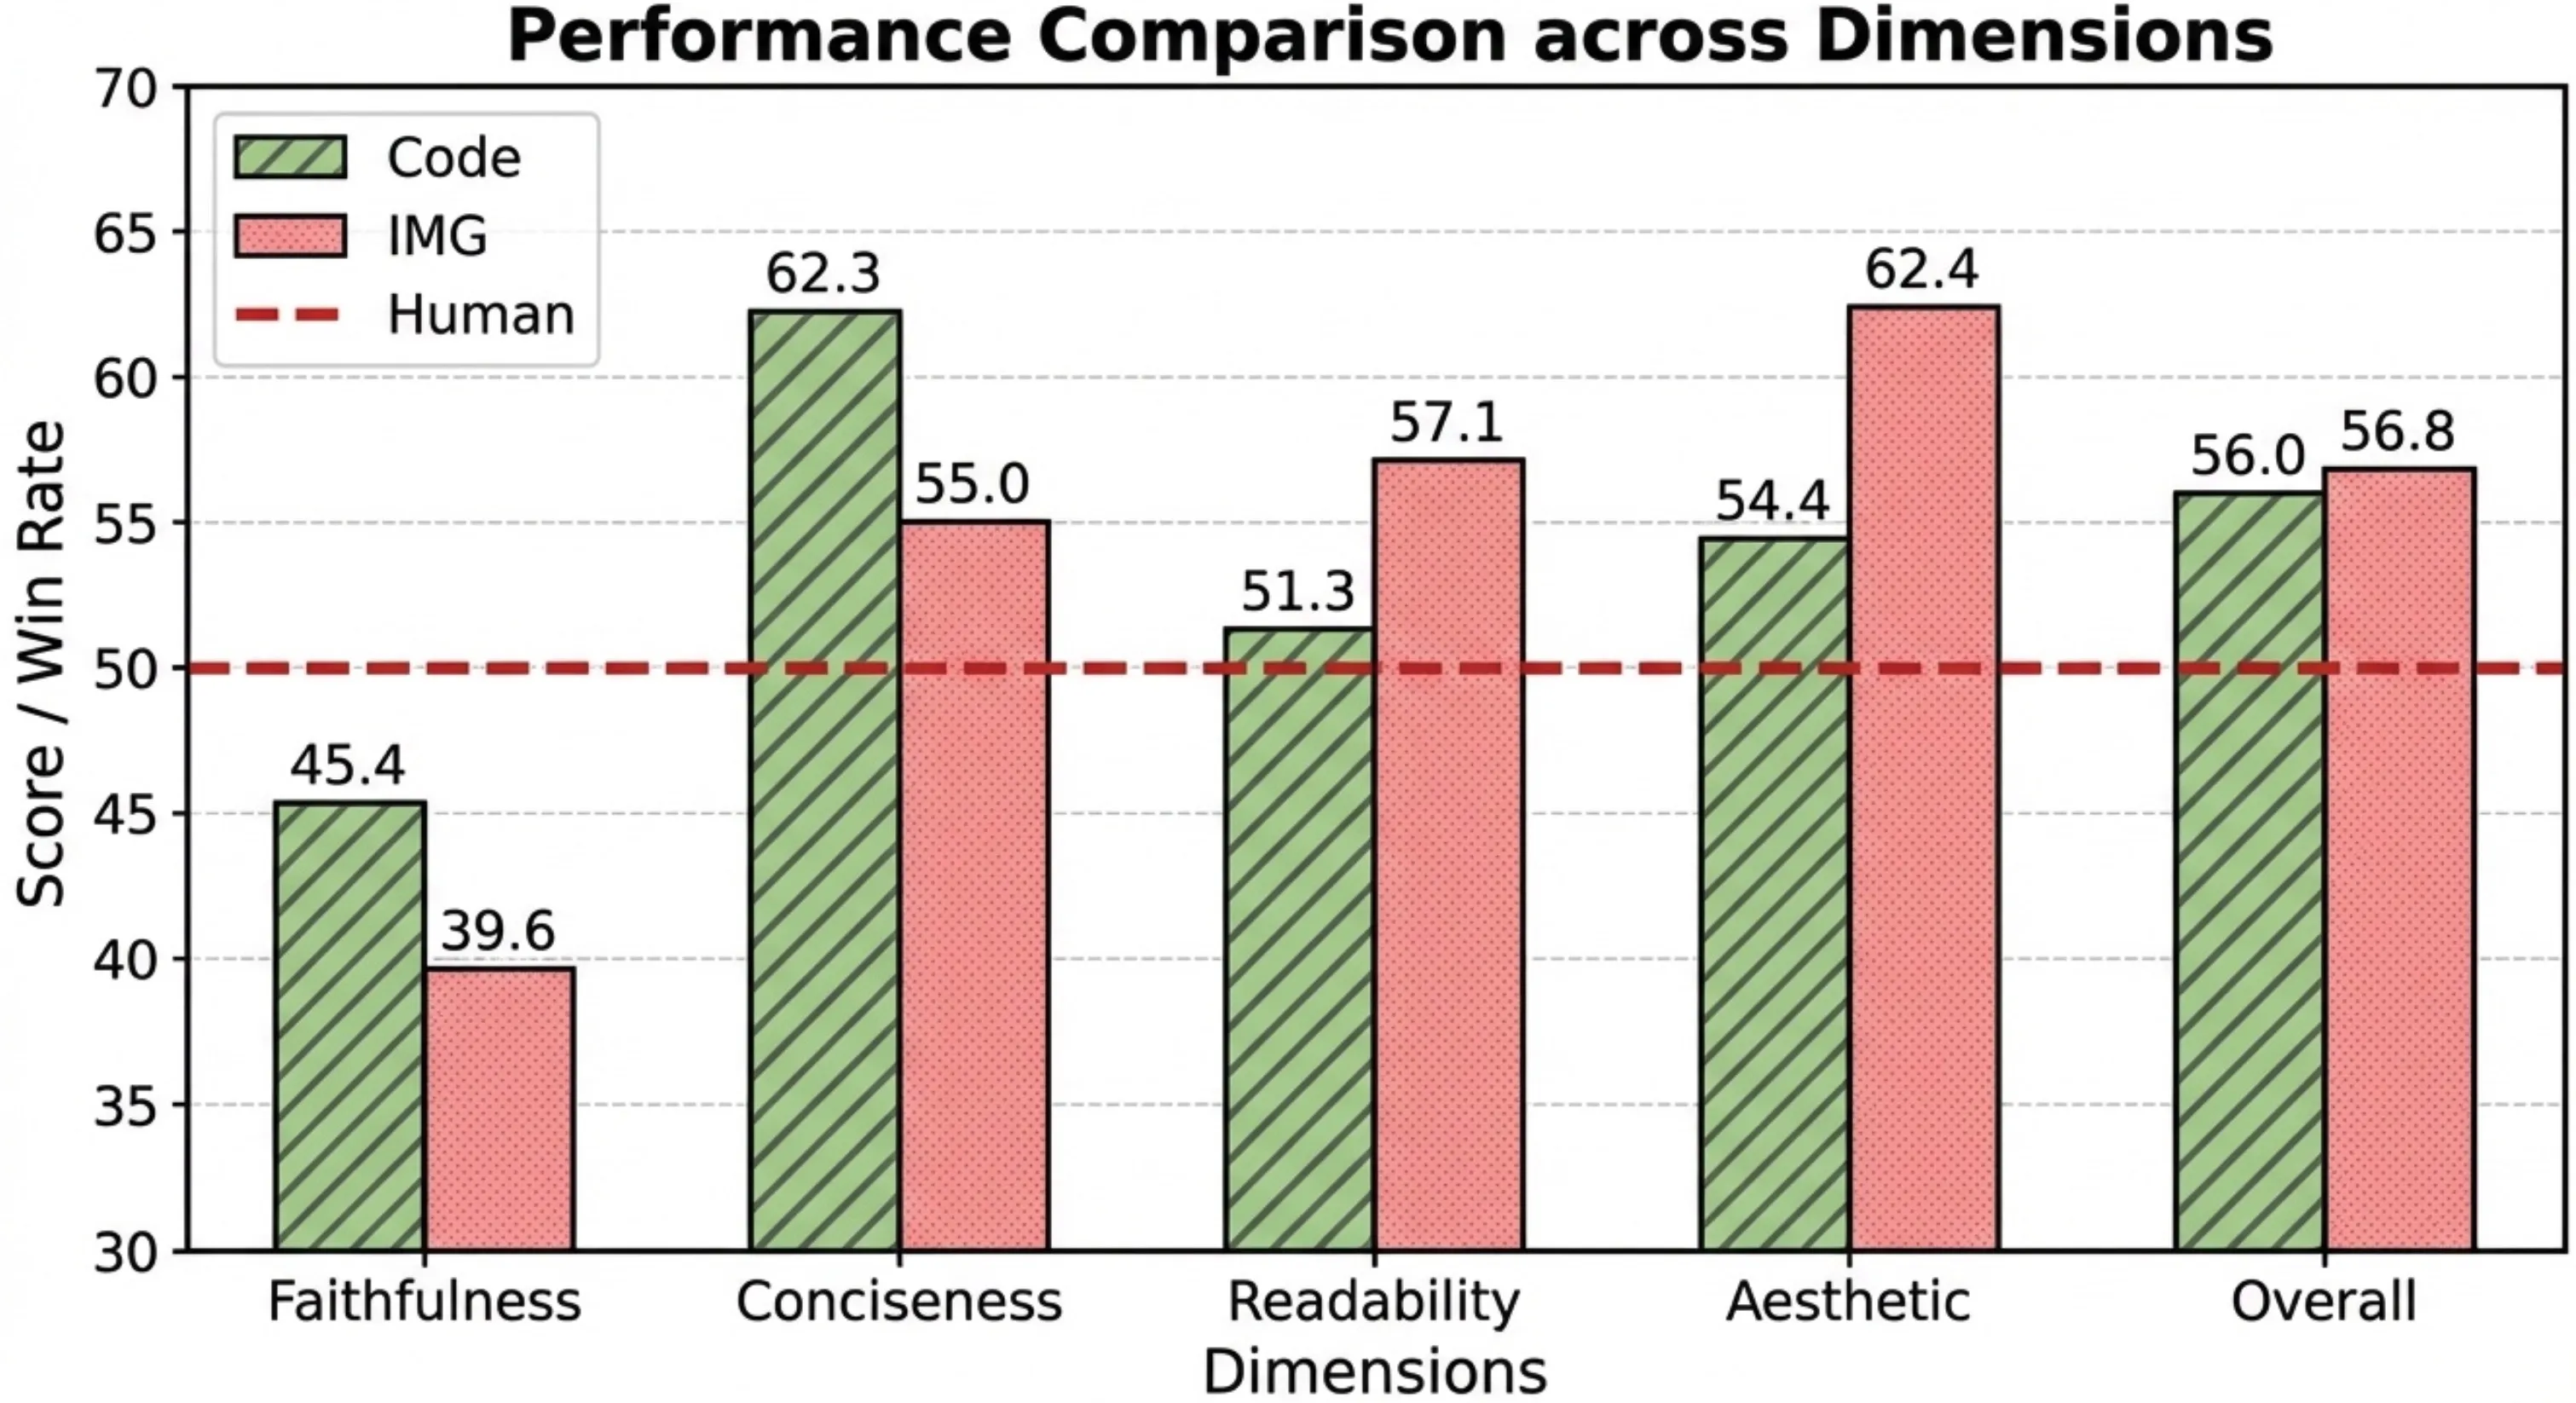
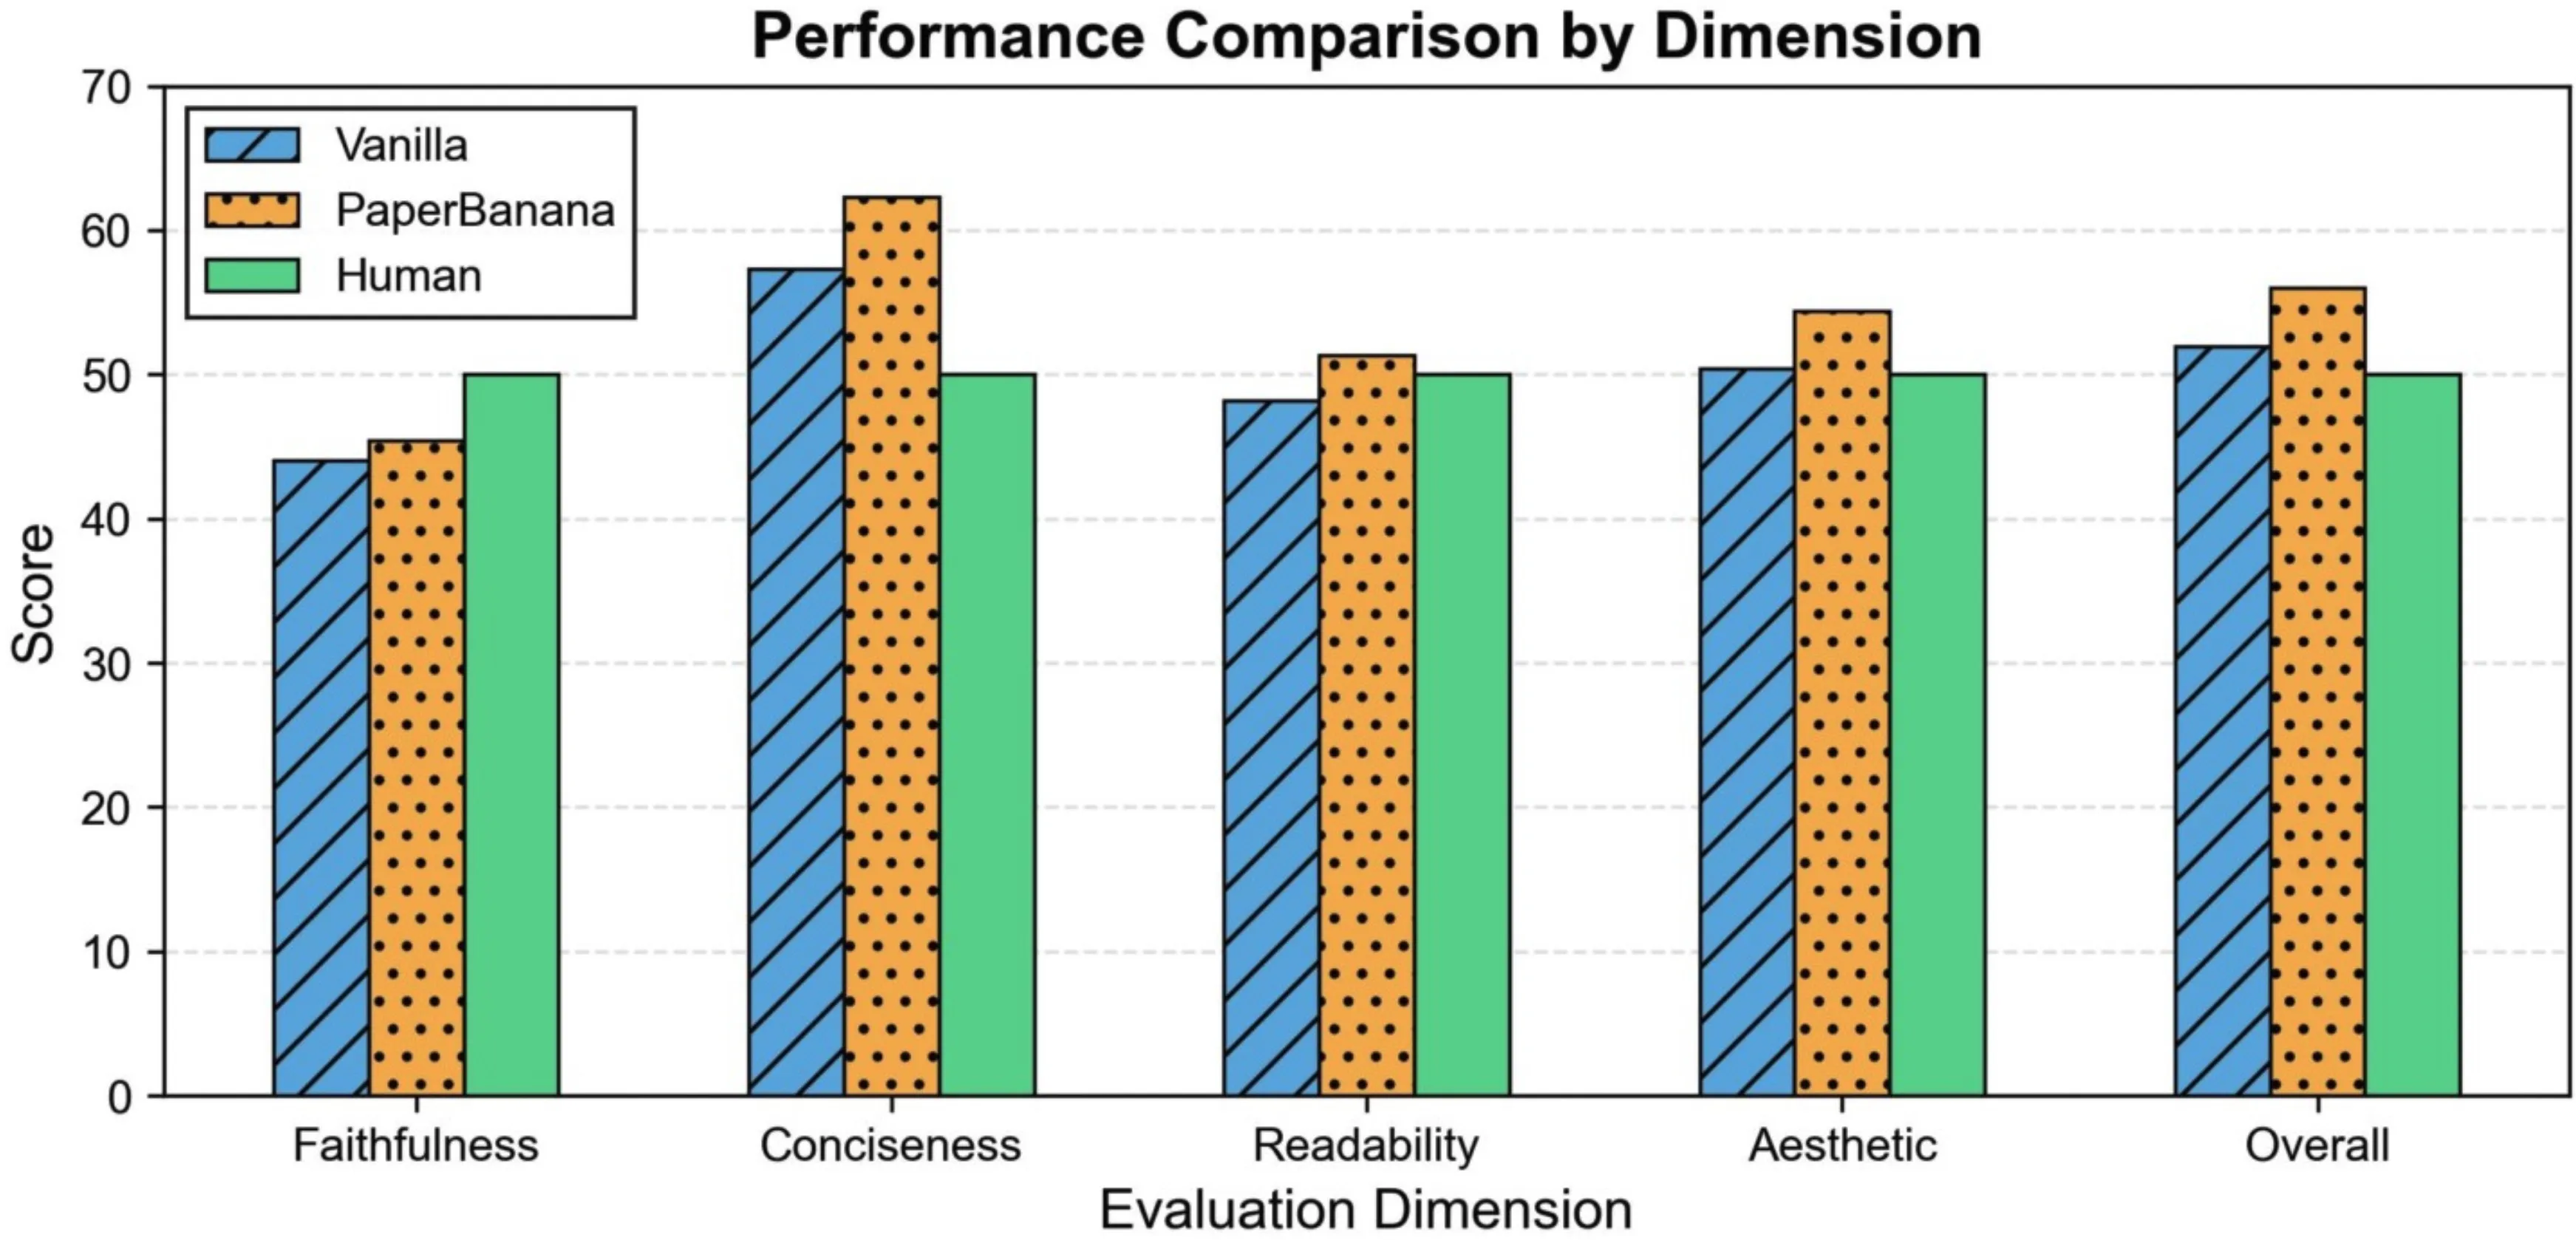
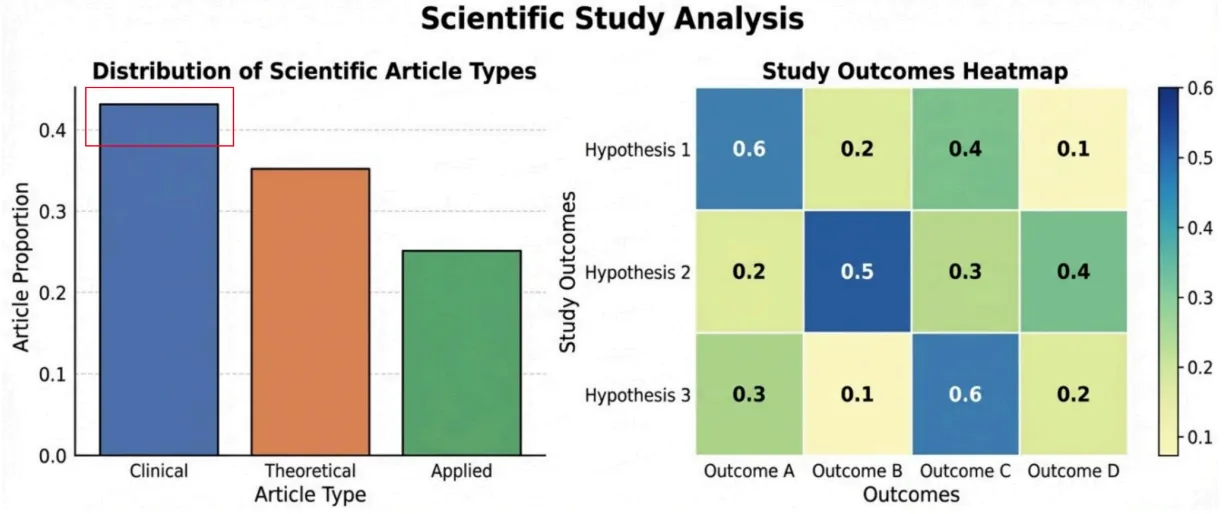
Performance comparison across coding and image dimensions
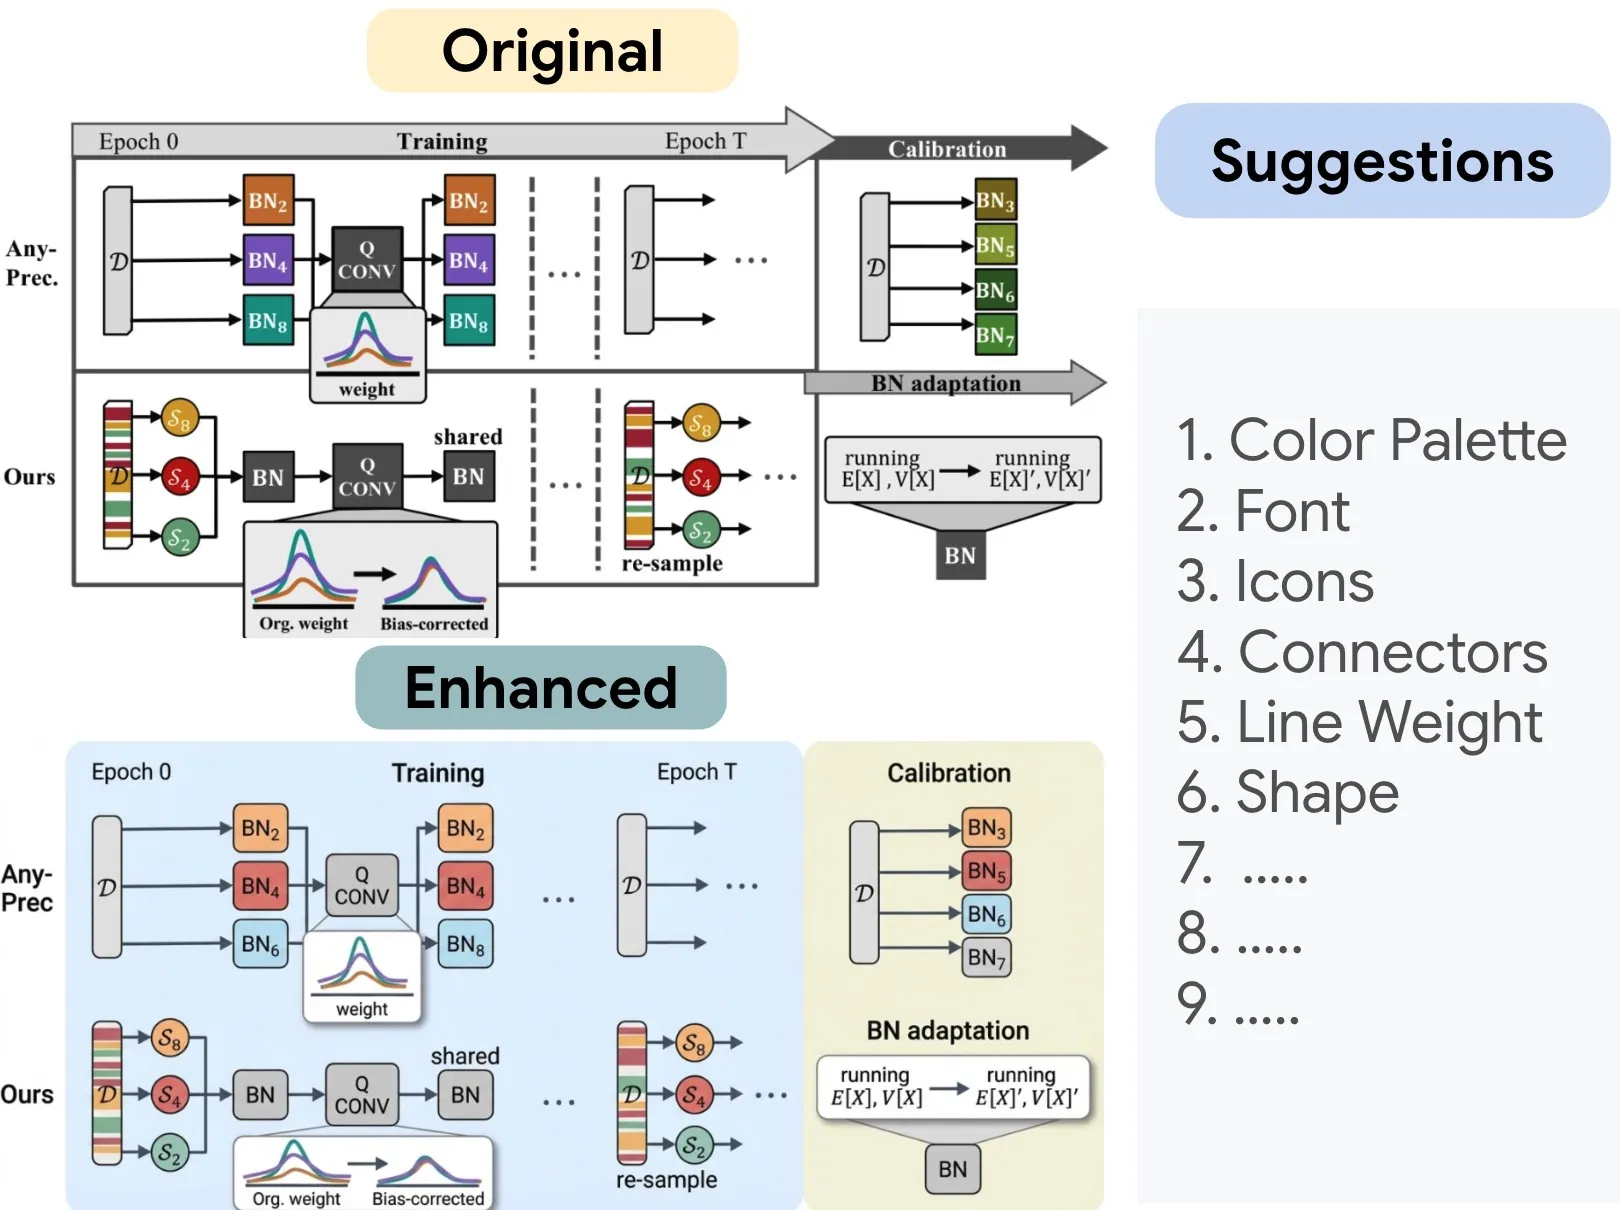
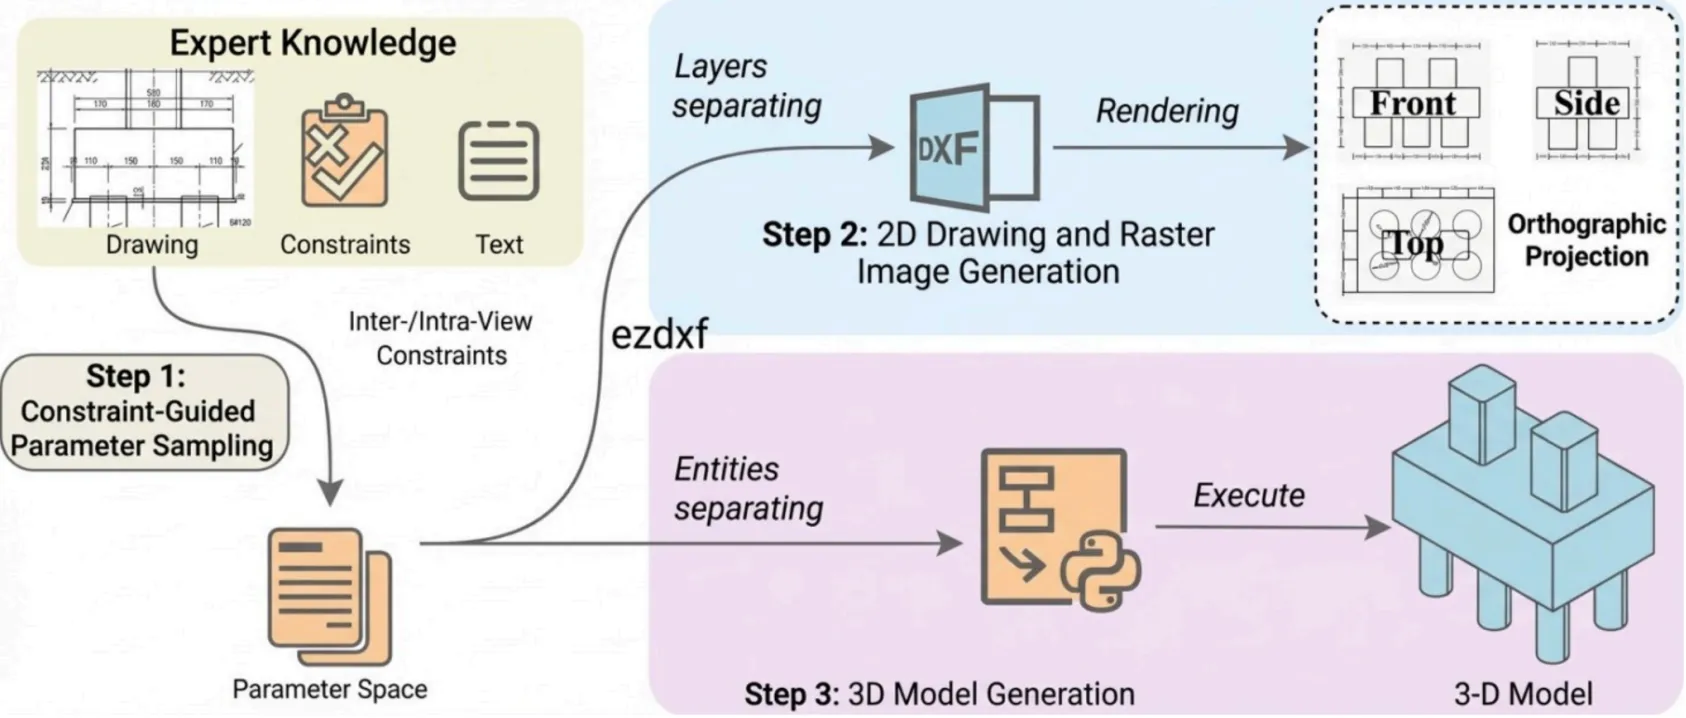
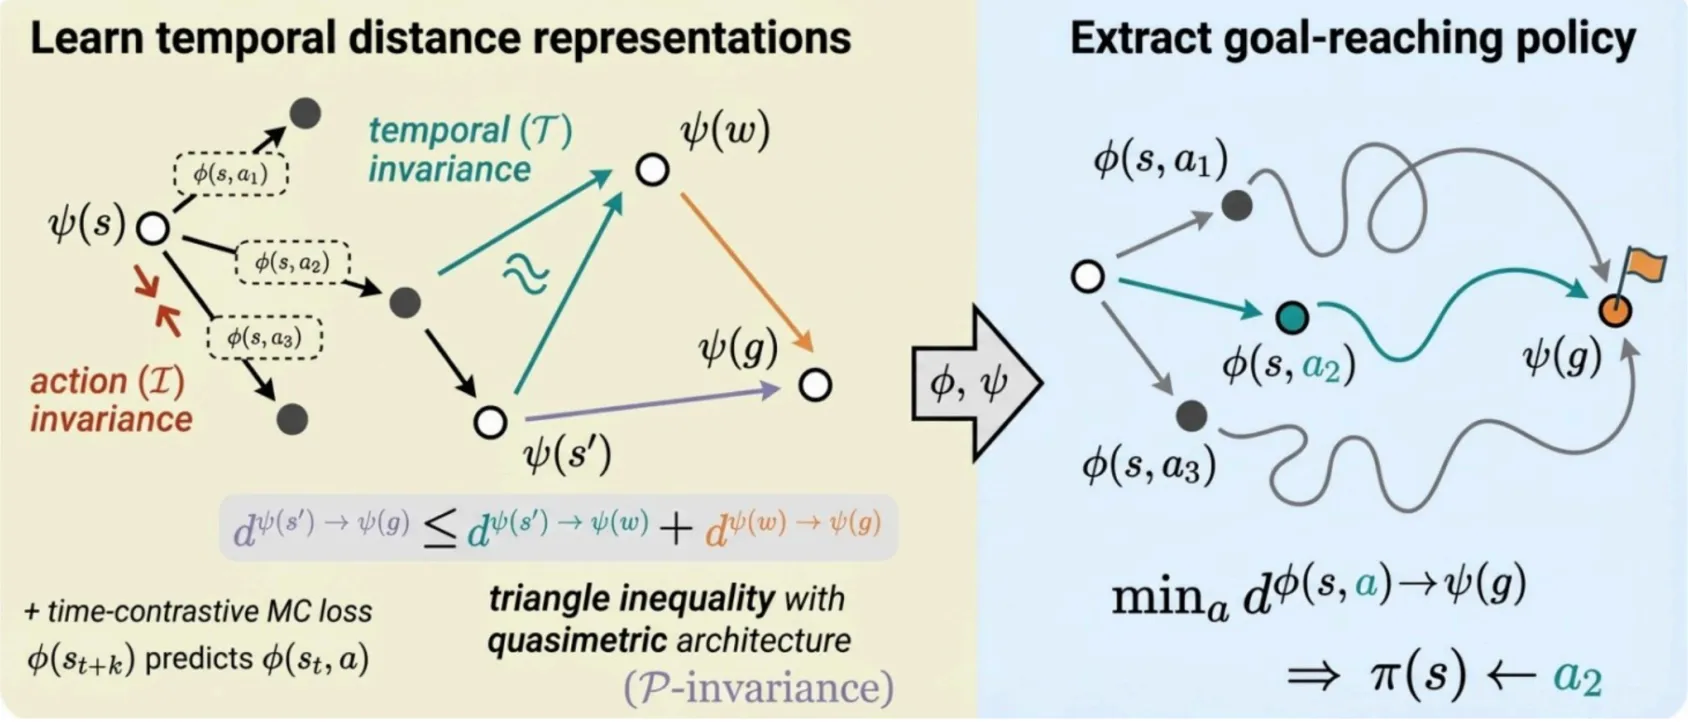
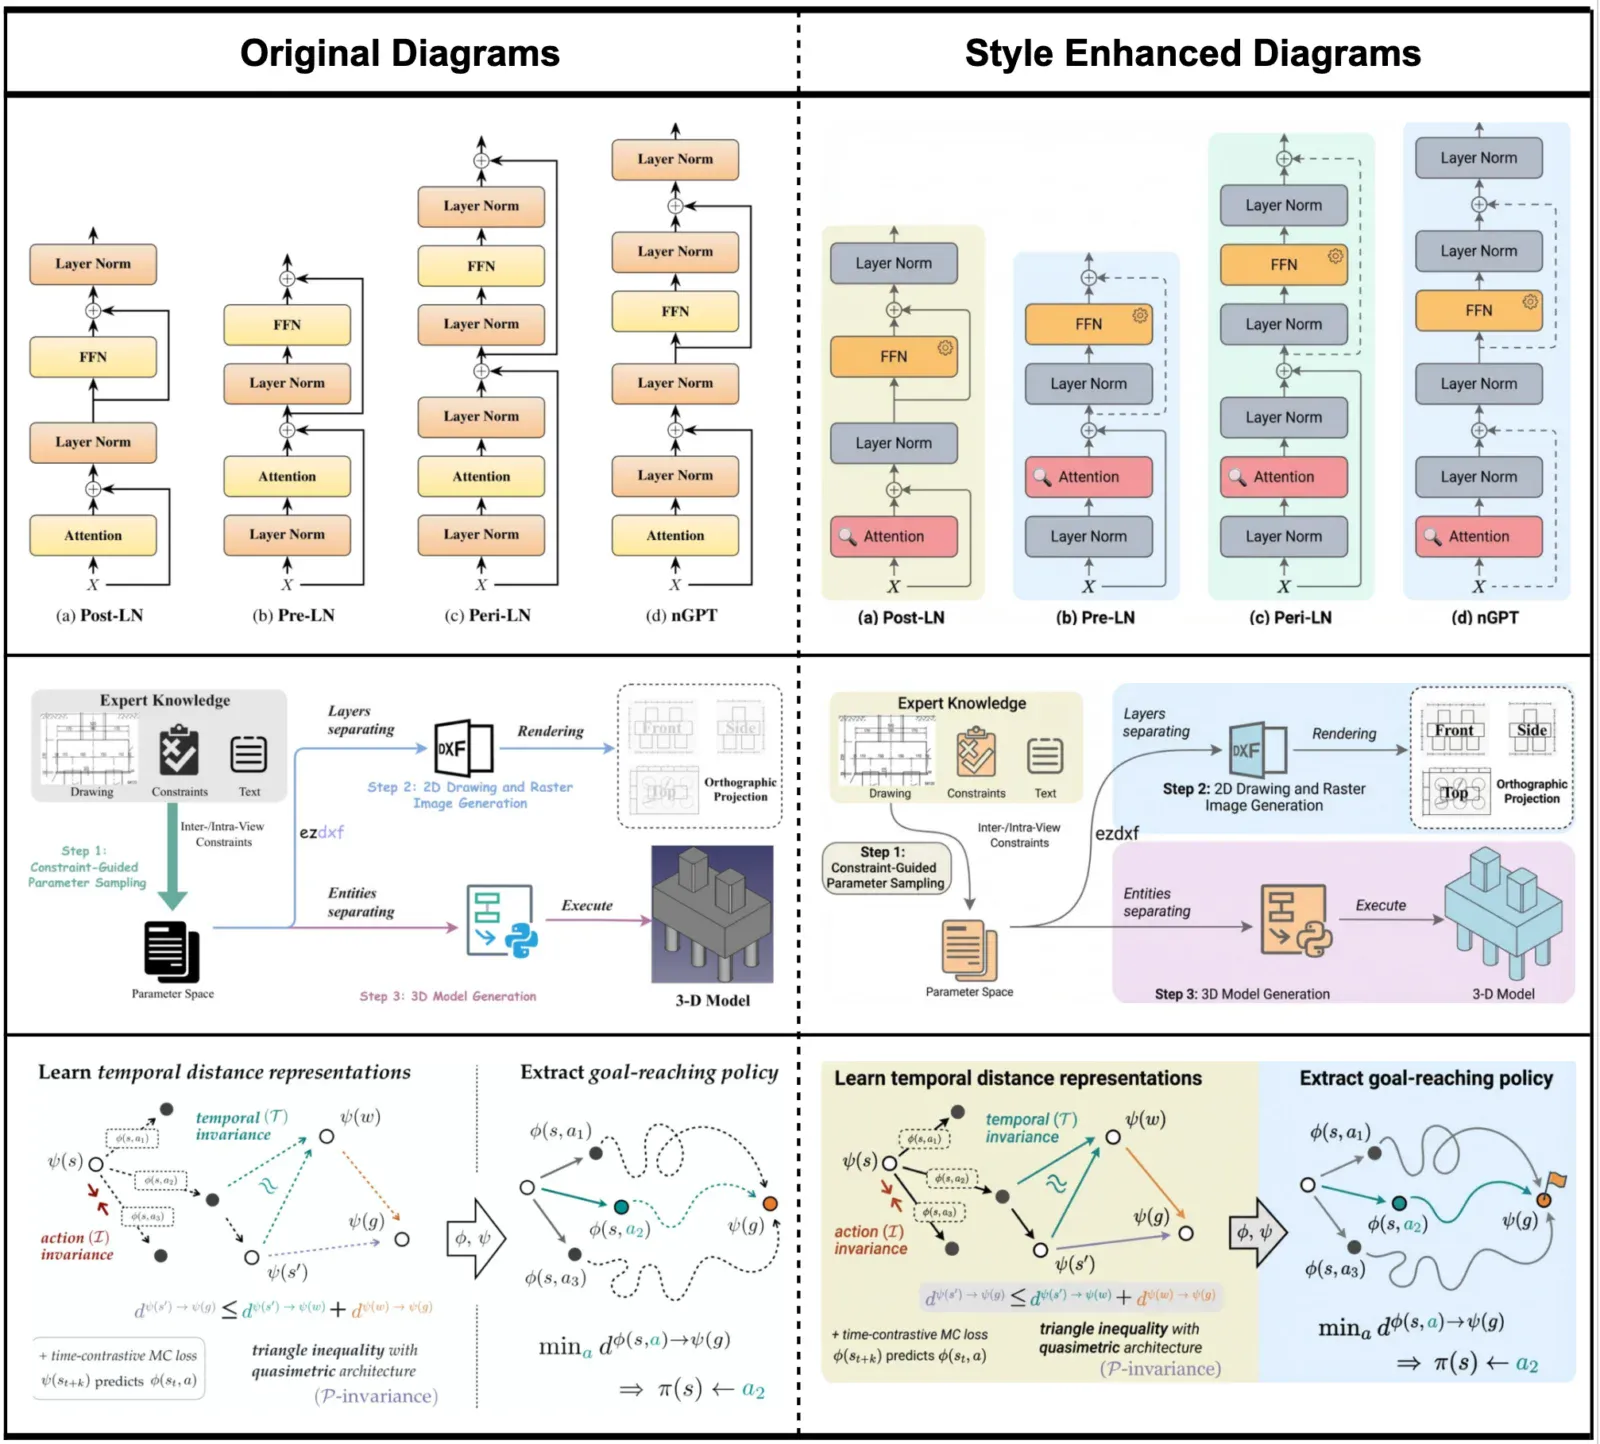
Aesthetically enhanced methodology diagram for publication
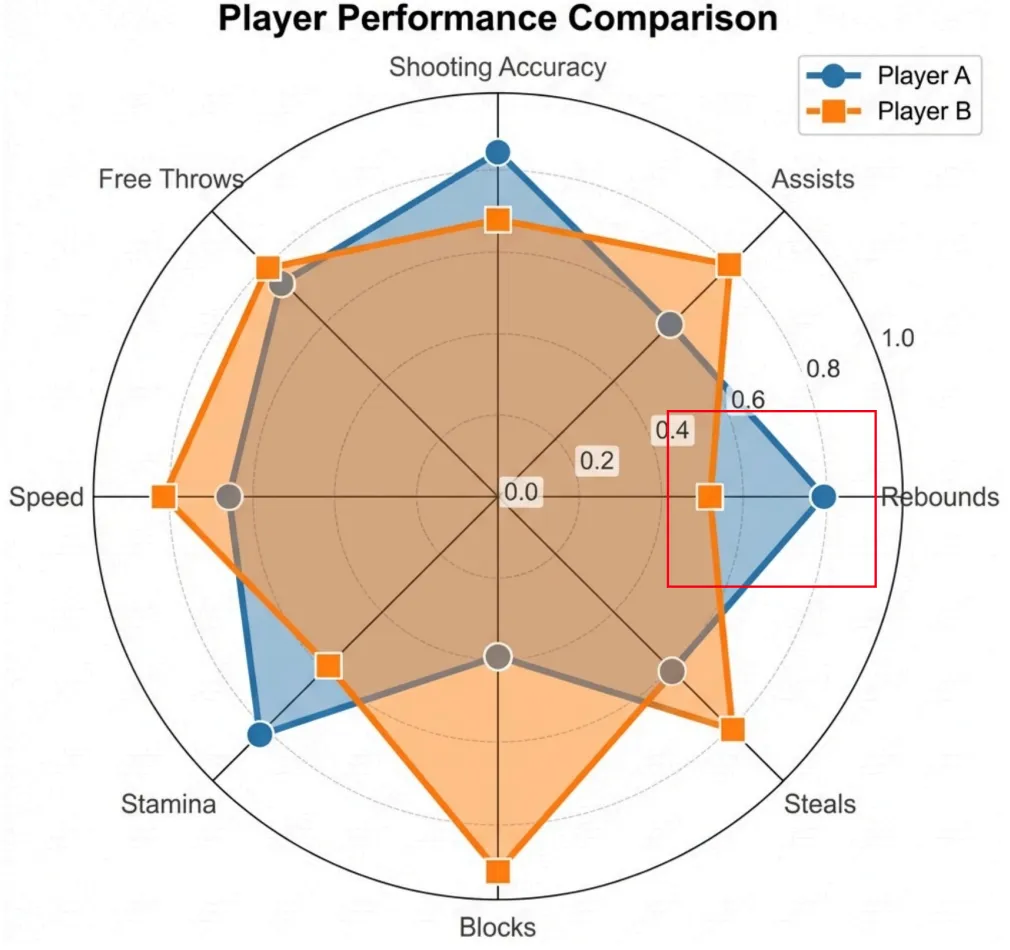
Multi-dimensional player performance radar chart
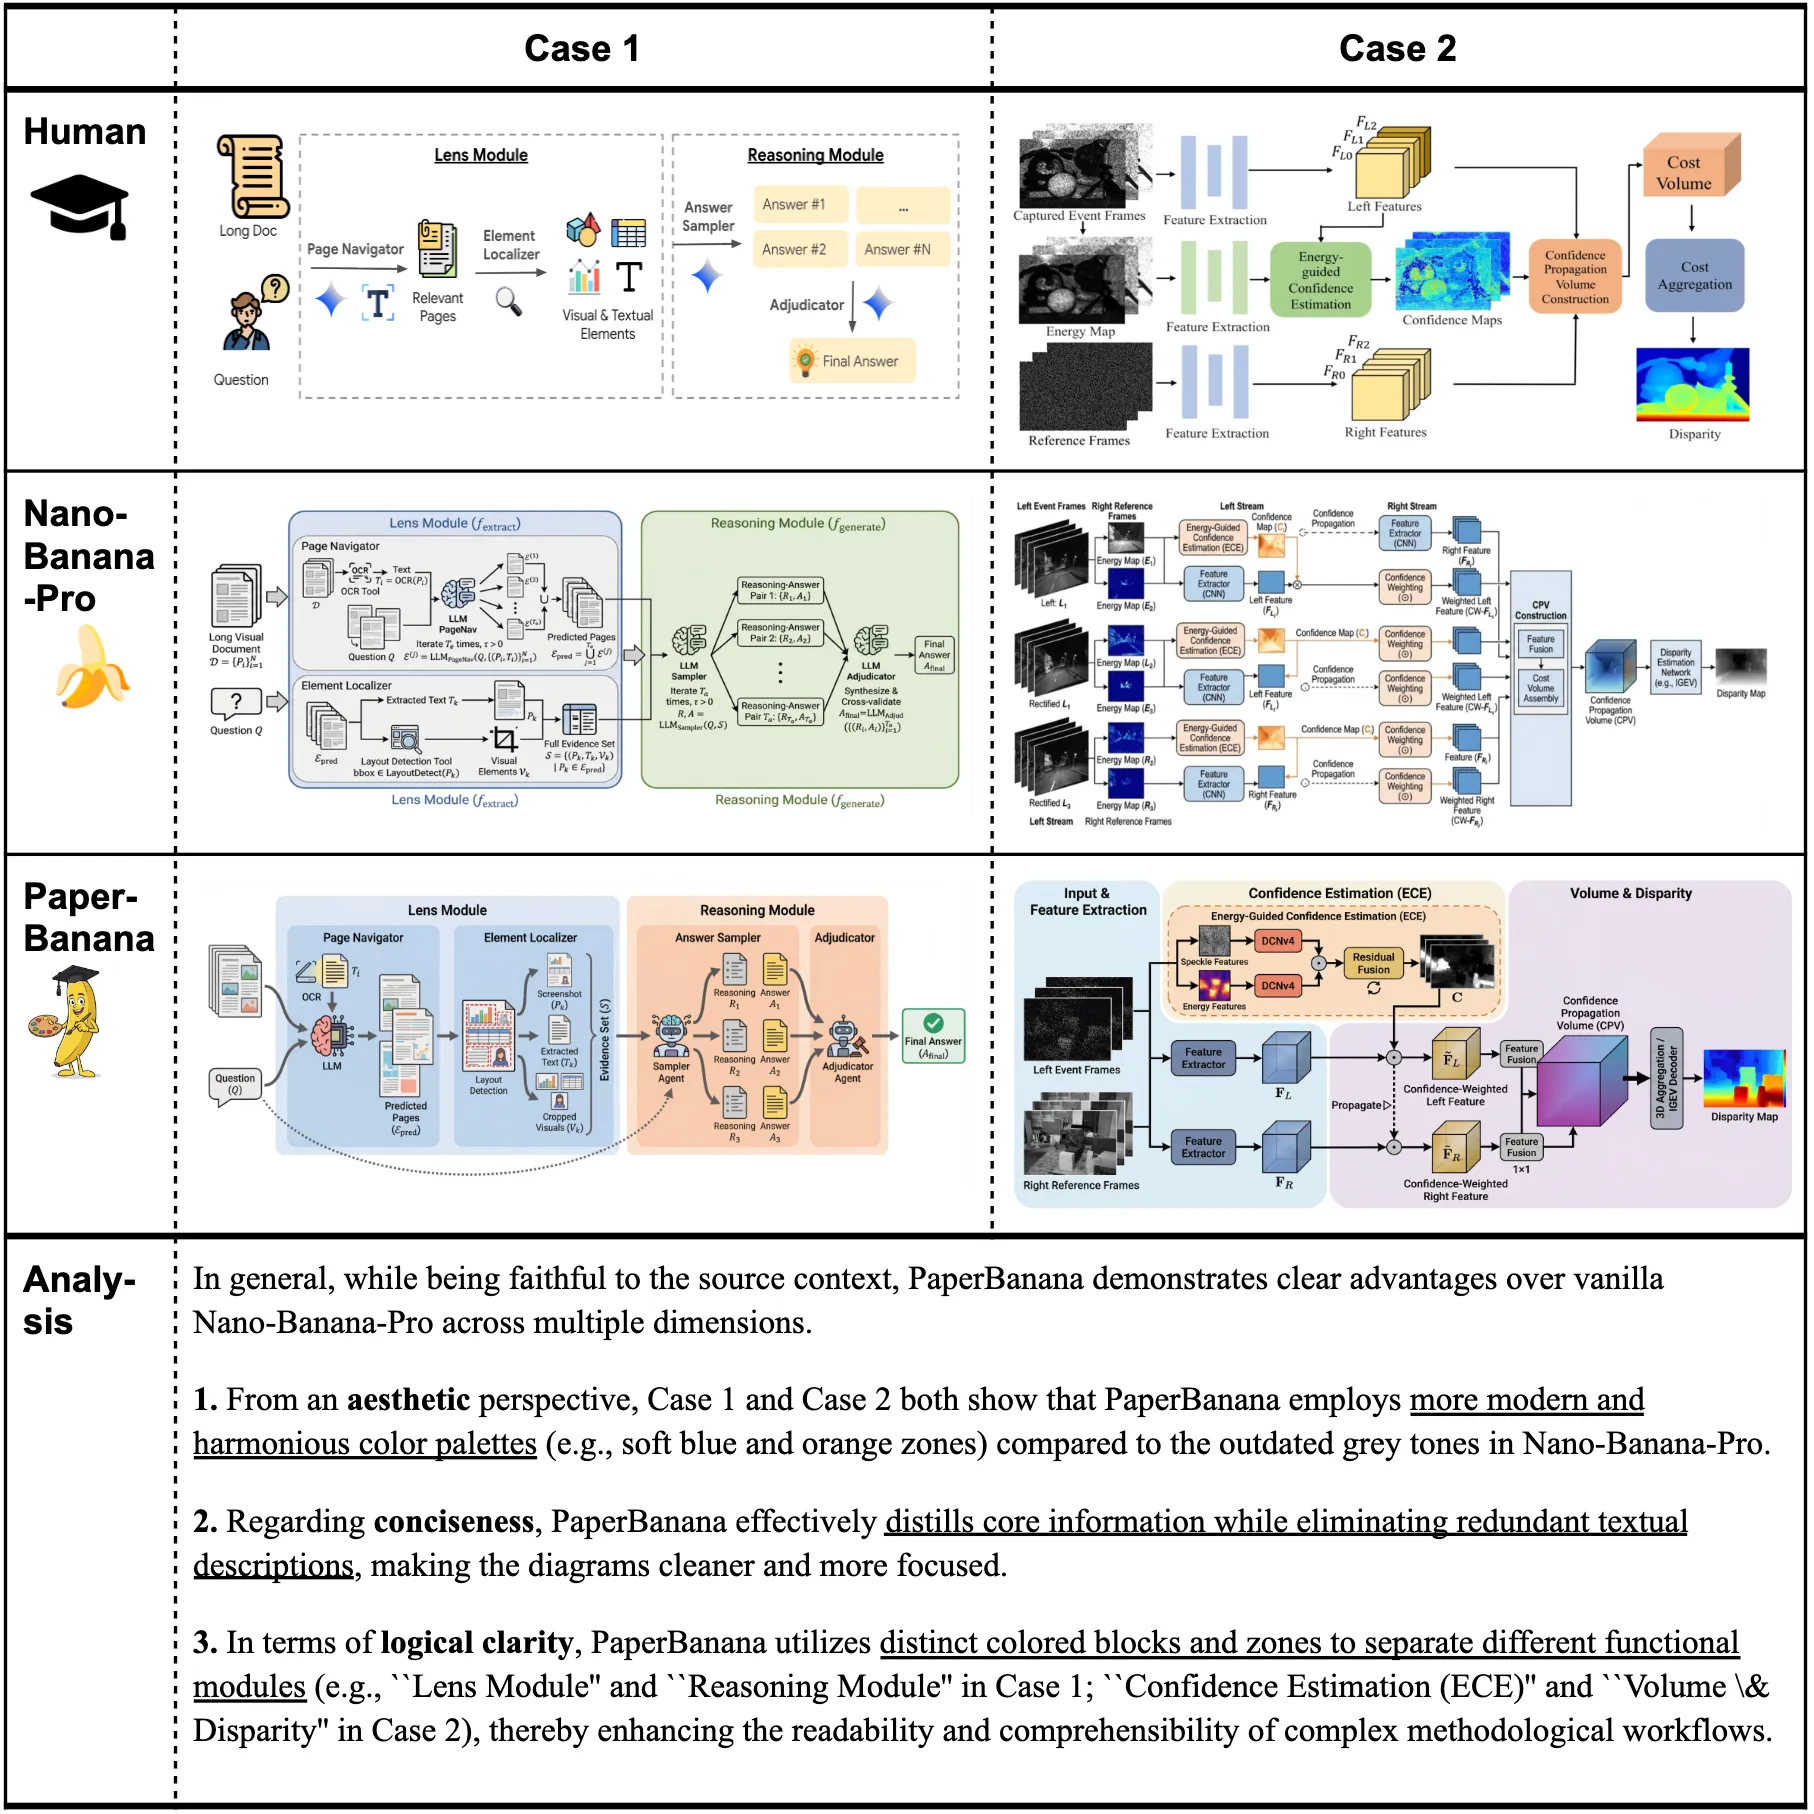
End-to-end case study with pipeline visualization
Side-by-side methodology diagram comparison
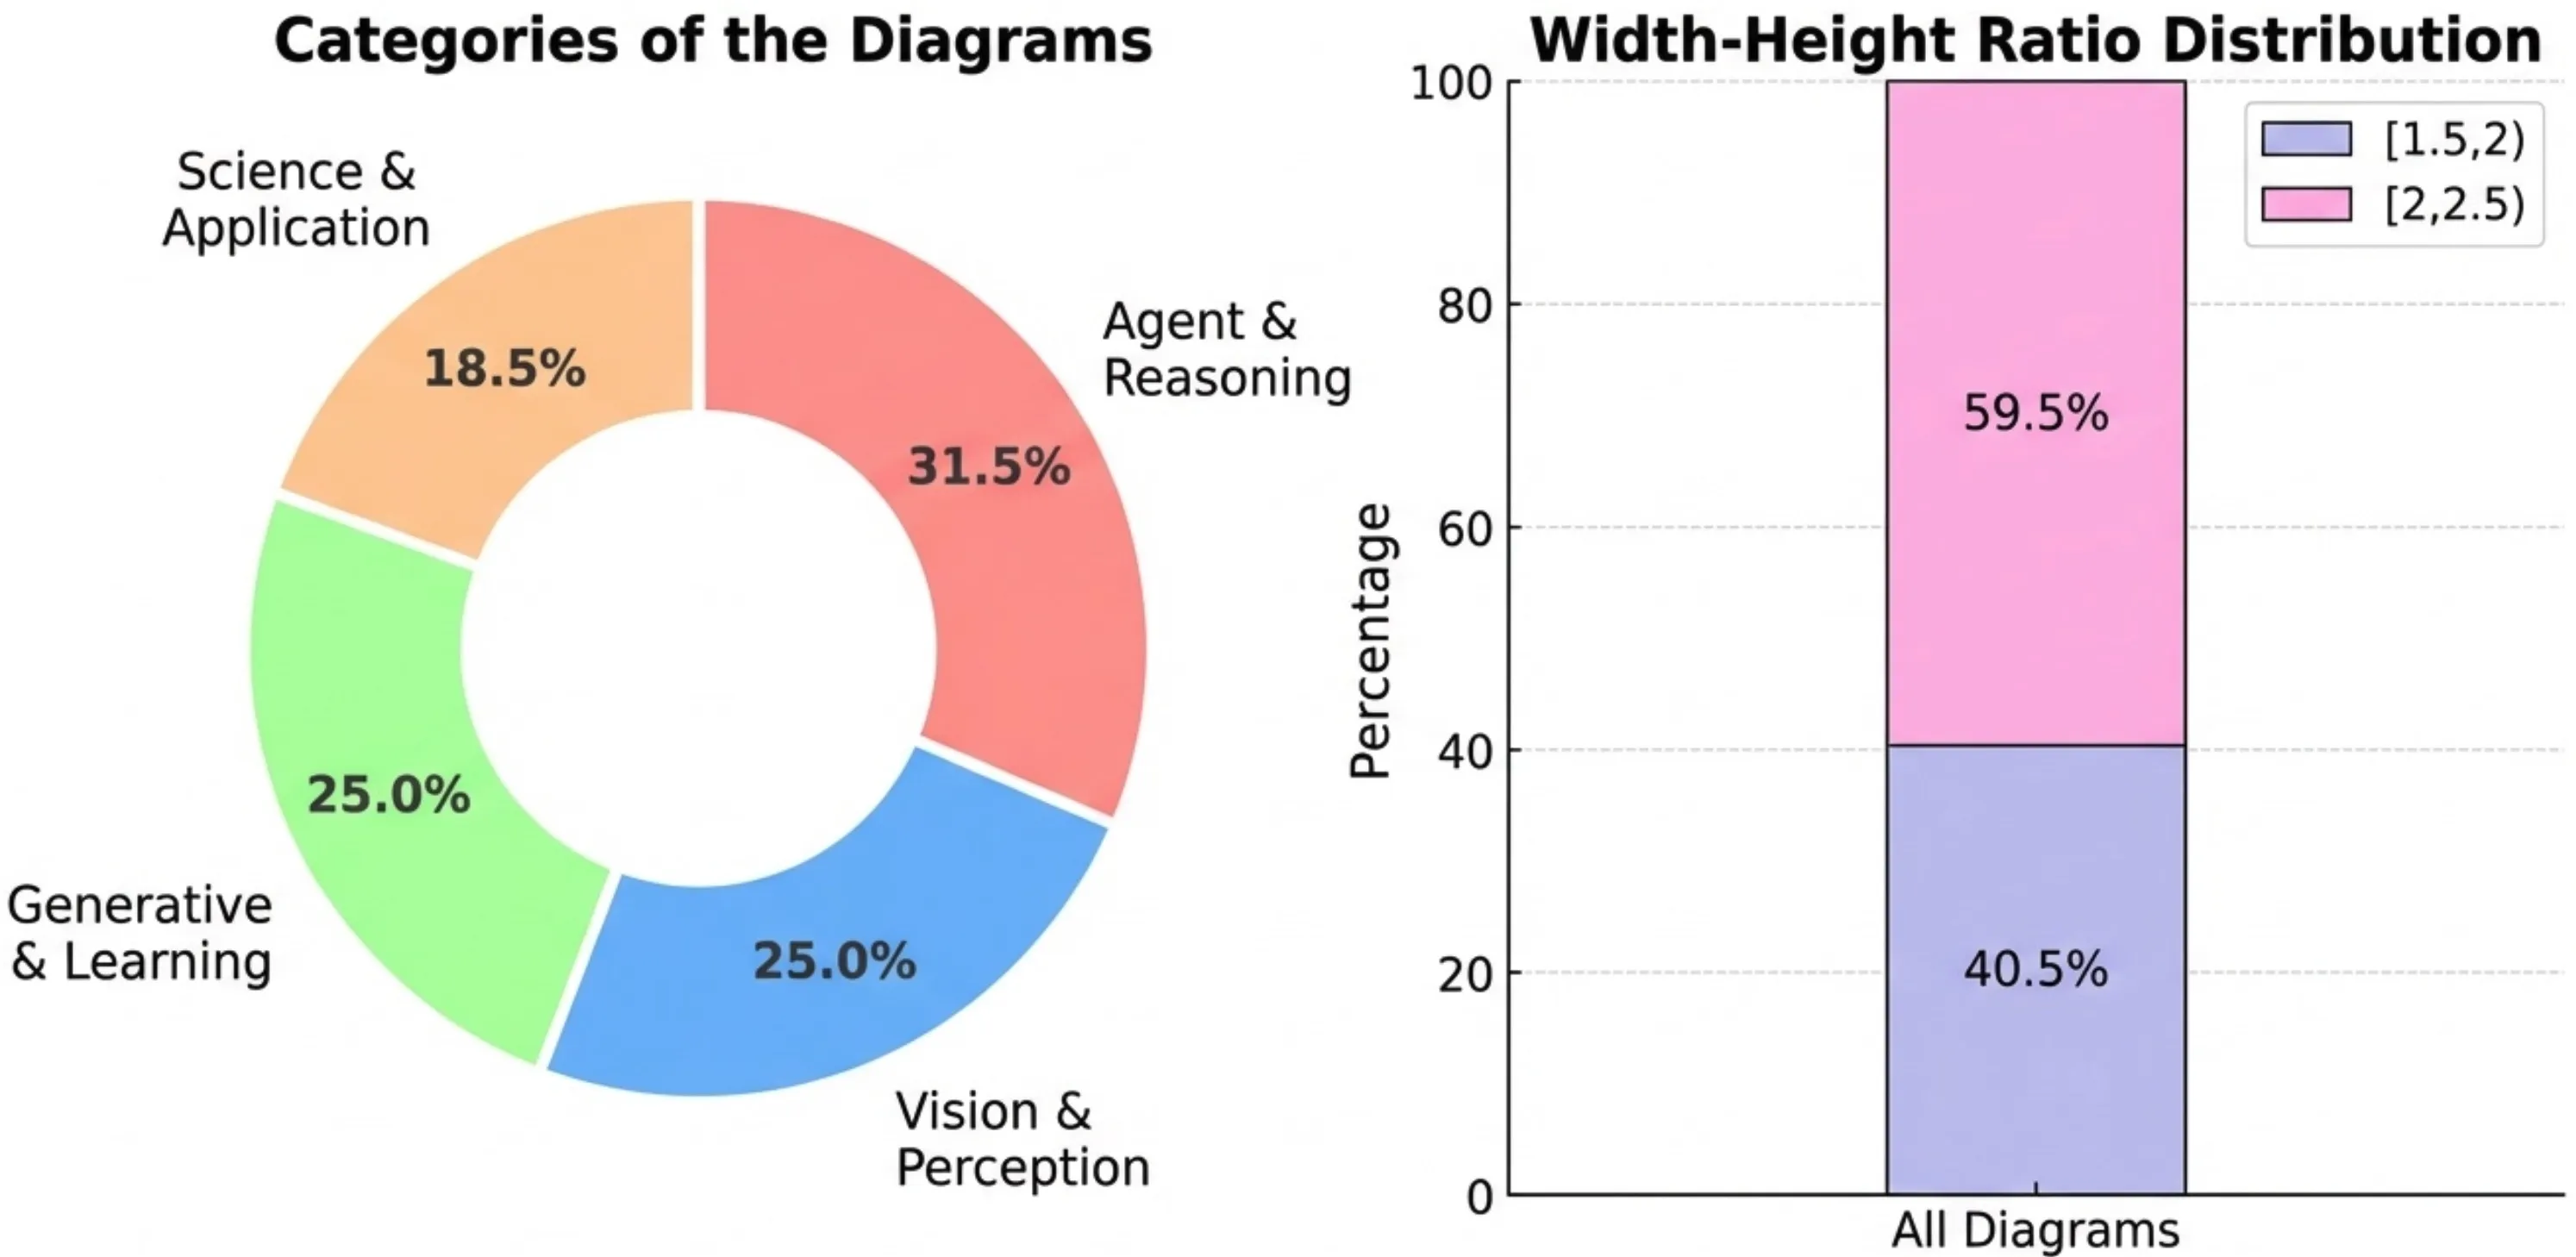
Diagram category classification overview
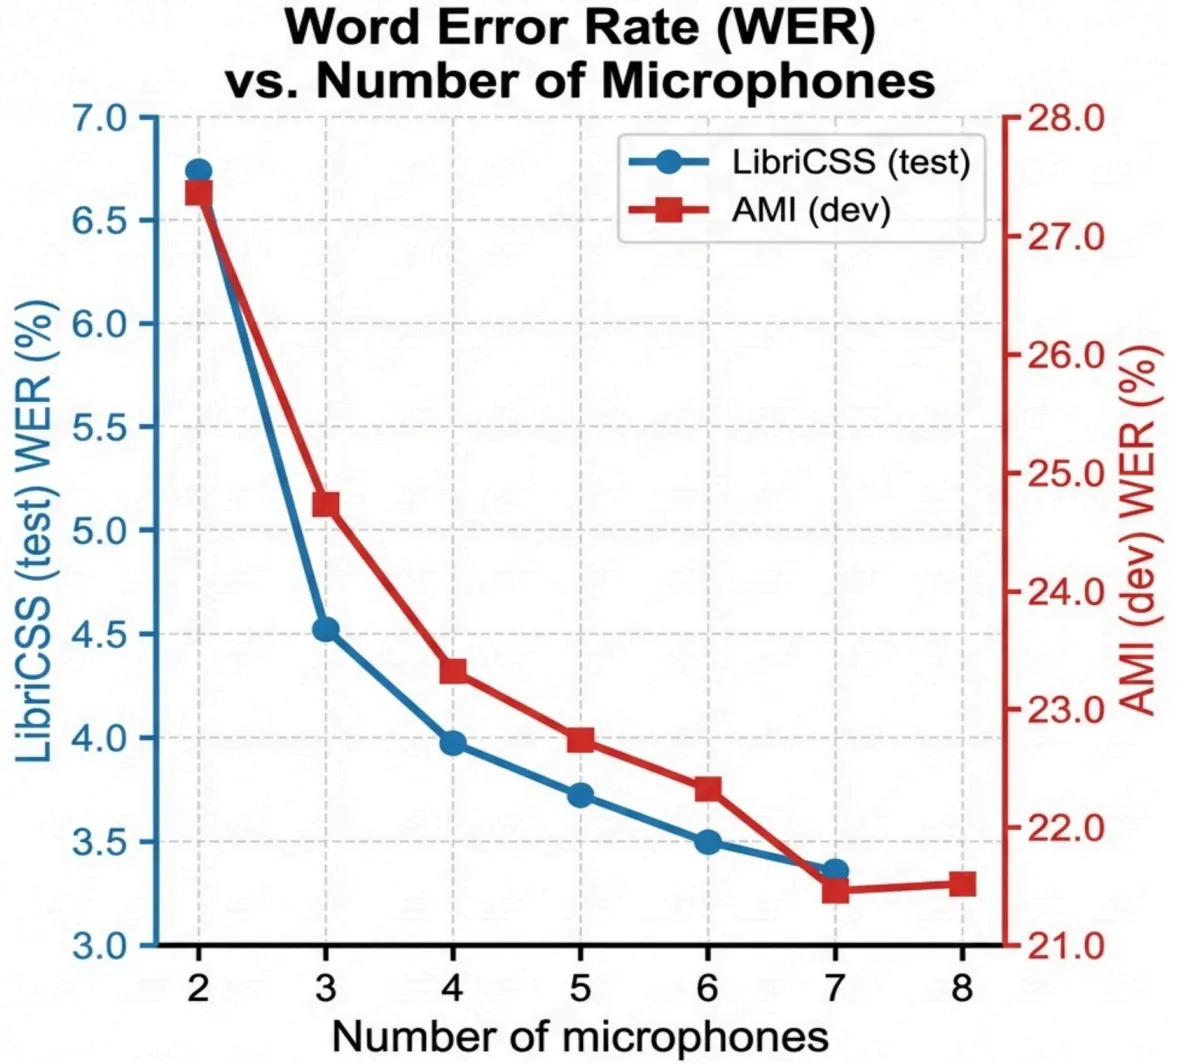
Dual-line trend analysis chart
The Paper Banana 5-Agent Pipeline
Paper Banana doesn't rely on a single prompt. Five specialized AI agents collaborate in sequence — each handling a distinct stage of figure generation — with a built-in feedback loop for iterative refinement.
Agent 1 — Retriever
Searches a curated database of reference diagrams from top venues (NeurIPS, ICML, CVPR) to find the most relevant visual examples. These references guide downstream agents through in-context learning.
Agent 2 — Planner
The cognitive core. Translates your methodology text into a detailed structural description — identifying components, connections, data flow direction, grouping hierarchy, and spatial layout.
Agent 3 — Stylist
Applies publication-grade aesthetic standards. Selects color palettes, typography, line weights, and spacing to match your target venue — from NeurIPS pastels to Nature's clean minimalism.
Agent 4 — Visualizer
Renders the final image using Nano Banana Pro (Gemini 3 Pro Image). For statistical plots, generates executable Matplotlib code instead — completely eliminating numerical hallucination.
Agent 5 — Critic
Reviews the output for faithfulness, readability, and aesthetics. Compares the generated figure against your source text point by point. If issues are found, triggers the Visualizer to re-generate with specific corrections.
Note: The Critic can trigger up to 5 refinement cycles, sending targeted feedback to the Visualizer — ensuring every Paper Banana figure meets publication standards before delivery.
From paper to figure in 3 steps
No design tools. No templates. Just describe what you need.
Paste your context
Paper text, methodology description, or experimental data in JSON
Describe the figure
Tell us what the figure should communicate — layout, emphasis, and style
Download your figure
High-resolution, publication-ready PNG in under 2 minutes
Choose Your Perfect Plan
Basic
What's included
- 10,800 Credits/year (delivered at once)
- Up to 1,080 images
- Access to Nano Banana Pro
- Standard support
- Watermark-free exports
Pro
What's included
- 30,000 Credits/year (delivered at once)
- Up to 3,000 images
- Access to Nano Banana Pro
- Priority support
- Watermark-free exports
Max
What's included
- 96,000 Credits/year (delivered at once)
- Up to 9,600 images
- Access to Nano Banana Pro
- Priority support
- Watermark-free exports
Frequently Asked Questions
What kind of figures can Paper Banana generate?
How does the Paper Banana 5-agent AI pipeline work?
How many credits does each generation cost?
What input format does the statistical plot tool accept?
Are the generated figures suitable for journal publication?
Do I need any design skills to use Paper Banana?
Can I edit the generated figures after downloading?
How long does generation take?
Start Generating Now
Join researchers at Stanford, MIT, Tsinghua, and ETH Zurich creating publication-ready figures every day. It's fast, it's accurate, and your first figure is free.
Your research data is never stored or used for training.